Well my last post certainly stirred up some Global Warming Enthusiasts who found it difficult to get their heads around the continued existence of The Pause. What will they make of this month’s update? The Pause refuses to go away, despite greatly exaggerated rumours of its death.
Dr Roy Spencer has just released UAH v6.0 data for March. This is a preliminary post with graphs only for the Globe, the Northern Hemisphere, the Southern Hemisphere, and the Tropics. Other regions will be updated in a few days’ time when the full data for March are released. (These preliminary figures may change slightly as well.)
These graphs show the furthest back one can go to show a zero or negative trend (less than +0.1C/ 100 years) in lower tropospheric temperatures. I calculate 12 month running means to remove the small possibility of seasonal autocorrelation in the monthly anomalies. Note: The satellite record commences in December 1978- now 37 years and 4 months long- 448 months. 12 month running means commence in November 1979. The graphs below start in December 1978, so the vertical gridlines denote Decembers. The final plotted points are March 2016.
Except for the Tropics, where The Pause has reduced by three months, in other regions it has remained at the same length.
[CLICK ON IMAGES TO ENLARGE]
Globe:

Sorry, GWEs, The Pause is still an embarrassing reality! For how much longer we don’t know.
And, for the special benefit of those who think that I am deliberately fudging data by using 12 month running means, here is the plot of monthly anomalies, which shows that The Pause is over in monthly anomalies by my rather strict criterion:
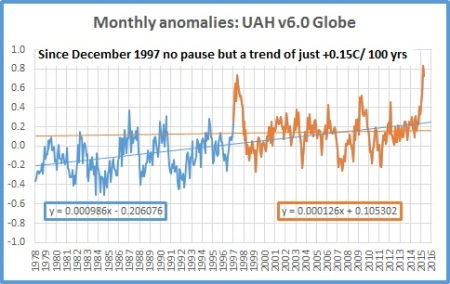
I will continue posting these figures showing these scarey trends from monthly anomalies. The Pause will return sooner with monthly anomalies than 12 month means of course. Meanwhile, shudder at the thought of 18 years and 4 months with a frightening trend of +0.15C +/-0.1C per 100 years.
Northern Hemisphere:

The Northern Hemisphere Pause refuses to go quietly and remains at nearly half the record. It may well disappear in the next month or two.
Southern Hemisphere:

For well over half the record the Southern Hemisphere has zero trend.
Tropics:

The Pause has shortened by three months, but is still well over half the record long.
In a few days the full dataset will be released and graphs for the other regions will be plotted as soon as possible. As I will be doing Jury duty for the next four weeks, posts and comments are likely to be few, and brief.
Tags: climate, global warming, Pause, temperature, UAH

April 3, 2016 at 8:38 am
These plots are quite sound data supporting the pause. However, it bothers me a little to see the last few months data rising as it does, although I expect that is in response to the quite strong El Nino, even if it was not the predicted “monster” . From what you are saying though, the least months have not been exceptional so we may see ta trend downwards leaving a peak which corresponds to those in 1998 and 2010.
I am still trying to find out about the “definition” of “temperature” as used by Roy and by the CSIRO on Australia as well as the IPCC. I believe the latter, (IPCC) use the anomaly for the effective temperature, (the fourth root of the mean of Ti^4) whereas I do not know and have not been able to find out, strangely enough, whether Spencer and the CSIRO use the same anomaly or that for the linear mean.
Best,
John
April 3, 2016 at 8:50 am
So Ken does that mean that the present trend shows no statistically significant warming trend from 1979 until the year 2100? That’s 121 years.
April 3, 2016 at 10:15 am
I’m afraid you’ve lost me there. The trend is zero for the last 18+ years. Who knows what it will be in 100 years time.
April 4, 2016 at 1:12 pm
A retired school principal? … How embarrassed your former teachers and students must feel for you, having to resort to such dodgy legerdemain.
April 4, 2016 at 2:35 pm
Hi John- so just like other GWE drive by commenters, you have no argument or anything worthwhile to say.
April 5, 2016 at 12:47 am
Hello Ken,
The worthwhile point is your use of 12 month averaging, ostensibly for auto-correlation, is without technical justification. Real scientists routinely consider auto-correlation issues in their analysis. None, skeptical or not, advance this stunt. Dr. Spencer would frown. Even professional disinformers like Monckton wouldn’t dare attempt that nonsense. Disinformers like Morano, OTOH, could not care less about professional or technical merit – he’ll publish anything in accord with the desired message; anything at all
Now, of course you’ll be shifting back to the un-averaged monthly data if you feel it advantageous. I think you’ll be disappointed when the La Nina moves into prominence and no calculation sleight-of-hand works for you. How embarrassing this whole exercise is.
April 3, 2016 at 7:47 pm
[…] The Pause Update: March 2016 (Preliminary) […]
April 4, 2016 at 4:31 pm
Could you please explain the method for working out the trend line equations? Taking the second graph as an example, you have listed the overall slope as 0.000986. Yet the change in temp. anomolies divided by years bounded by the trend line is approximately (0.2 – (-0.2))/40, or 0.01.
Further, for the orange section you have the slope as 0.000126 which you then describe as indicating a temperature rise of 0.15 degrees per 100 years (should this not be 1 degree per century, anyway [http://www.ysbl.york.ac.uk/~cowtan/applets/trend/trend.html]? You seem out by an order of magnitude).
April 4, 2016 at 6:44 pm
Thank you for your enquiry, showing you have at least the intelligence to study the results.
There are 1200 months in 100 years, so 0.000986 x 1200 = 1.18C per 100 years, and 0.000126 x 1200 = 0.15C/ 100 years.
By your method, 0.4C x 100 yrs /38 yrs = 1.05C approximately.
April 5, 2016 at 12:52 pm
Thank you for the explanation of the 0.15 deg/100 years, but I’m afraid I still don’t understand the equations for your trend lines.
Fitting linear trend lines to the v5.6 global data (I could not find the full dataset for v6), I get an equation of y=0.0147x-29.403 for Dec 1978 to the present, and y=0.0111x-22.127 for Dec 1997 to the present. If this trend continued it would result in a temperature increase at a rate of 1.11 degrees per 100 years, not 0.15 degrees per 100 years.
I accept the datasets are different, but not that different.
April 5, 2016 at 3:06 pm
You are doing something completely different to me I think. I use monthly datapoints, 1200 of them in 100 years. (NOT annual datapoints, or December datapoints, whose slope you would multiply by 100.) Have a look at the second graph above. The red/orange trend line increases by much less than 0.1 in 38 years (from about 0.1 to well under 0.2) so can hardly increase by another 1.01 in the next 62 years.
Here are the global data:
1978 12 -0.36
1979 1 -0.33
1979 2 -0.27
1979 3 -0.26
1979 4 -0.28
1979 5 -0.27
1979 6 -0.26
1979 7 -0.18
1979 8 -0.28
1979 9 -0.16
1979 10 -0.01
1979 11 -0.13
1979 12 -0.08
1980 1 -0.08
1980 2 0.06
1980 3 -0.03
1980 4 0.03
1980 5 0.06
1980 6 0.09
1980 7 -0.04
1980 8 -0.03
1980 9 -0.01
1980 10 -0.16
1980 11 -0.14
1980 12 -0.25
1981 1 -0.08
1981 2 0.01
1981 3 -0.13
1981 4 -0.13
1981 5 -0.14
1981 6 -0.18
1981 7 -0.08
1981 8 -0.08
1981 9 -0.16
1981 10 -0.19
1981 11 -0.15
1981 12 -0.02
1982 1 -0.23
1982 2 -0.25
1982 3 -0.32
1982 4 -0.32
1982 5 -0.31
1982 6 -0.25
1982 7 -0.41
1982 8 -0.33
1982 9 -0.3
1982 10 -0.39
1982 11 -0.27
1982 12 -0.17
1983 1 0.01
1983 2 -0.17
1983 3 0.15
1983 4 0.08
1983 5 0.09
1983 6 -0.18
1983 7 0
1983 8 0.03
1983 9 -0.01
1983 10 -0.1
1983 11 -0.08
1983 12 -0.31
1984 1 -0.36
1984 2 -0.23
1984 3 -0.14
1984 4 -0.25
1984 5 -0.11
1984 6 -0.21
1984 7 -0.29
1984 8 -0.21
1984 9 -0.51
1984 10 -0.07
1984 11 -0.21
1984 12 -0.26
1985 1 -0.3
1985 2 -0.48
1985 3 -0.46
1985 4 -0.31
1985 5 -0.32
1985 6 -0.35
1985 7 -0.51
1985 8 -0.26
1985 9 -0.37
1985 10 -0.43
1985 11 -0.28
1985 12 -0.26
1986 1 -0.15
1986 2 -0.37
1986 3 -0.28
1986 4 -0.16
1986 5 -0.13
1986 6 -0.18
1986 7 -0.24
1986 8 -0.25
1986 9 -0.3
1986 10 -0.3
1986 11 -0.15
1986 12 -0.11
1987 1 0.09
1987 2 0.08
1987 3 -0.21
1987 4 0.08
1987 5 -0.08
1987 6 0.17
1987 7 0.05
1987 8 -0.05
1987 9 -0.07
1987 10 0.09
1987 11 0.08
1987 12 0.37
1988 1 0.15
1988 2 -0.06
1988 3 0.16
1988 4 0.03
1988 5 0.09
1988 6 0.08
1988 7 0.16
1988 8 0.06
1988 9 0.2
1988 10 -0.06
1988 11 -0.13
1988 12 -0.21
1989 1 -0.4
1989 2 -0.27
1989 3 -0.31
1989 4 -0.2
1989 5 -0.31
1989 6 -0.27
1989 7 -0.18
1989 8 -0.17
1989 9 -0.04
1989 10 -0.12
1989 11 -0.17
1989 12 -0.06
1990 1 -0.1
1990 2 -0.2
1990 3 0.06
1990 4 -0.08
1990 5 0.08
1990 6 0.1
1990 7 0.02
1990 8 -0.05
1990 9 -0.11
1990 10 0.02
1990 11 0.25
1990 12 0.16
1991 1 0.03
1991 2 0.08
1991 3 0.23
1991 4 -0.01
1991 5 0.12
1991 6 0.31
1991 7 0.14
1991 8 0.15
1991 9 -0.05
1991 10 -0.21
1991 11 -0.27
1991 12 -0.28
1992 1 -0.19
1992 2 -0.23
1992 3 -0.14
1992 4 -0.27
1992 5 -0.23
1992 6 -0.21
1992 7 -0.37
1992 8 -0.45
1992 9 -0.43
1992 10 -0.24
1992 11 -0.27
1992 12 -0.33
1993 1 -0.35
1993 2 -0.28
1993 3 -0.43
1993 4 -0.34
1993 5 -0.2
1993 6 -0.08
1993 7 -0.06
1993 8 -0.18
1993 9 -0.33
1993 10 -0.11
1993 11 -0.12
1993 12 0.05
1994 1 -0.11
1994 2 -0.2
1994 3 -0.19
1994 4 -0.15
1994 5 -0.1
1994 6 0.07
1994 7 0.04
1994 8 -0.06
1994 9 0.02
1994 10 -0.22
1994 11 0.05
1994 12 0.08
1995 1 0.05
1995 2 -0.02
1995 3 -0.07
1995 4 0.14
1995 5 0.05
1995 6 0.14
1995 7 0.07
1995 8 0.28
1995 9 0.22
1995 10 0.09
1995 11 0.08
1995 12 -0.18
1996 1 -0.15
1996 2 0.01
1996 3 0.05
1996 4 -0.08
1996 5 -0.1
1996 6 -0.07
1996 7 0.03
1996 8 0.08
1996 9 0.14
1996 10 0.05
1996 11 0.03
1996 12 -0.08
1997 1 -0.15
1997 2 -0.08
1997 3 -0.13
1997 4 -0.26
1997 5 -0.1
1997 6 -0.03
1997 7 0.09
1997 8 0.09
1997 9 0.06
1997 10 0.1
1997 11 0.09
1997 12 0.25
1998 1 0.48
1998 2 0.65
1998 3 0.47
1998 4 0.74
1998 5 0.64
1998 6 0.57
1998 7 0.51
1998 8 0.52
1998 9 0.44
1998 10 0.4
1998 11 0.12
1998 12 0.25
1999 1 0.06
1999 2 0.17
1999 3 -0.08
1999 4 0.01
1999 5 -0.04
1999 6 -0.15
1999 7 -0.02
1999 8 -0.07
1999 9 0.05
1999 10 -0.01
1999 11 -0.07
1999 12 -0.04
2000 1 -0.27
2000 2 -0.07
2000 3 -0.01
2000 4 0.05
2000 5 0.09
2000 6 0.07
2000 7 -0.05
2000 8 -0.11
2000 9 0.02
2000 10 0.04
2000 11 0.01
2000 12 -0.02
2001 1 -0.05
2001 2 0.1
2001 3 0.05
2001 4 0.2
2001 5 0.2
2001 6 0.03
2001 7 0.08
2001 8 0.25
2001 9 0
2001 10 0.19
2001 11 0.18
2001 12 0.16
2002 1 0.24
2002 2 0.3
2002 3 0.24
2002 4 0.23
2002 5 0.25
2002 6 0.3
2002 7 0.23
2002 8 0.18
2002 9 0.2
2002 10 0.07
2002 11 0.21
2002 12 0.15
2003 1 0.34
2003 2 0.25
2003 3 0.15
2003 4 0.15
2003 5 0.21
2003 6 0
2003 7 0.08
2003 8 0.09
2003 9 0.14
2003 10 0.28
2003 11 0.17
2003 12 0.38
2004 1 0.21
2004 2 0.25
2004 3 0.35
2004 4 0.14
2004 5 0.08
2004 6 0
2004 7 -0.23
2004 8 -0.1
2004 9 0.02
2004 10 0.15
2004 11 0.06
2004 12 0.05
2005 1 0.29
2005 2 0.18
2005 3 0.19
2005 4 0.33
2005 5 0.13
2005 6 0.15
2005 7 0.22
2005 8 0.1
2005 9 0.25
2005 10 0.27
2005 11 0.2
2005 12 0.08
2006 1 0.15
2006 2 0.17
2006 3 0.16
2006 4 0.07
2006 5 -0.09
2006 6 0.06
2006 7 0.11
2006 8 0.13
2006 9 0.14
2006 10 0.22
2006 11 0.07
2006 12 0.17
2007 1 0.43
2007 2 0.19
2007 3 0.26
2007 4 0.14
2007 5 0.14
2007 6 0.13
2007 7 0.18
2007 8 0.2
2007 9 0.12
2007 10 0.12
2007 11 0.04
2007 12 -0.04
2008 1 -0.22
2008 2 -0.13
2008 3 -0.14
2008 4 -0.13
2008 5 -0.26
2008 6 -0.18
2008 7 -0.1
2008 8 -0.16
2008 9 0.02
2008 10 0
2008 11 0.06
2008 12 0.02
2009 1 0.11
2009 2 0.12
2009 3 0.03
2009 4 -0.01
2009 5 -0.05
2009 6 -0.16
2009 7 0.21
2009 8 0.06
2009 9 0.27
2009 10 0.17
2009 11 0.28
2009 12 0.12
2010 1 0.5
2010 2 0.46
2010 3 0.52
2010 4 0.33
2010 5 0.42
2010 6 0.31
2010 7 0.33
2010 8 0.35
2010 9 0.38
2010 10 0.2
2010 11 0.17
2010 12 0.09
2011 1 -0.06
2011 2 -0.05
2011 3 -0.18
2011 4 -0.03
2011 5 0.01
2011 6 0.14
2011 7 0.2
2011 8 0.16
2011 9 0.17
2011 10 -0.04
2011 11 -0.02
2011 12 0.01
2012 1 -0.2
2012 2 -0.22
2012 3 -0.03
2012 4 0.11
2012 5 0.06
2012 6 0.14
2012 7 0.02
2012 8 0.09
2012 9 0.22
2012 10 0.24
2012 11 0.18
2012 12 0.13
2013 1 0.46
2013 2 0.13
2013 3 0.1
2013 4 0.05
2013 5 0.01
2013 6 0.2
2013 7 0.04
2013 8 0.04
2013 9 0.22
2013 10 0.19
2013 11 0.05
2013 12 0.14
2014 1 0.2
2014 2 0.14
2014 3 0.09
2014 4 0.11
2014 5 0.25
2014 6 0.25
2014 7 0.21
2014 8 0.06
2014 9 0.15
2014 10 0.25
2014 11 0.24
2014 12 0.22
2015 1 0.3
2015 2 0.19
2015 3 0.17
2015 4 0.09
2015 5 0.27
2015 6 0.31
2015 7 0.16
2015 8 0.25
2015 9 0.23
2015 10 0.41
2015 11 0.33
2015 12 0.45
2016 1 0.54
2016 2 0.83
2016 3 0.73
Drop that into Excel, graph it and add a linear trendline, and display the equation. You should get 0.000986x+ an intercept. Then repeat with data from December 1997. Multiply the slope by 1200. Good luck.
April 5, 2016 at 4:57 pm
OK, it does seem to be due to the difference in the datasets – the slopes for 5.6 and 6 are quite different post-1997. Thanks.
April 5, 2016 at 1:20 am
How do you graph (split) 2 separate trend lines from a single data set?
April 5, 2016 at 6:14 am
I graph two datasets: the whole series, and the series showing only the pause, which overwrites the first one..
April 5, 2016 at 2:06 am
[…] Der Plot zeigt den laufenden 12-Monats-Trend der UAH-Satellitendaten von 1979 bis März 2016. Seit Juni 1997, also seit 18 Jahren und 10 Monaten, zeigen die T-Abweichungen keinen signifikanten Anstieg der globalen Temperaturen der unteren Troposphäre (TLT) bei UAH. Quelle: The Pause Update: March 2016 (Preliminary) […]
April 5, 2016 at 5:58 am
Nice to meet you.
I am Japanese woman.
Because I was very impressed with your work, I translated it into Japanese.
Thank you very much!
http://kiryenet.seesaa.net/article/436219565.html
April 5, 2016 at 6:15 am
The satellite data are now cooling, and the global average is likely to drop very sharply in the coming months. Strong evidence a La Nina of some strength is going to develop. Whether temperatures will drop back down to “pause” levels is unknown, but the satellite data are not going to look very good for warming alarmists.
April 5, 2016 at 6:20 am
True, but it will take some time. In 12 month averages, I don’t expect the pause to reappear until early 2018, monthly a few months earlier. If the cooling drop is more pronounced it will be sooner of course, but I expect the pause will still disappear for at least a year.
April 5, 2016 at 6:16 am
John@EF:
“Now, of course you’ll be shifting back to the un-averaged monthly data if you feel it advantageous.”
So you’ll just have to wait and see what happens won’t you.
April 6, 2016 at 12:56 am
Indeed. And, of course, if you wished to be completely fair you’d change your pause criterion to – 0.1C, as it is indistinguishable from 0.0C +/- 0.1C. {rolls eyes} Shameful.
April 6, 2016 at 7:33 am
Good grief, how pathetic. Of course anything between -0.1 and +0.1 is indistinguishable from zero. Above +0.1 is warming, below -0.1 is cooling. Which is why the south polar region is cooling, as the negative trend exceeds -0.1C.
April 6, 2016 at 3:43 am
Pausing at record highs?
April 6, 2016 at 7:34 am
Yep- since the previous warm period anyway.
April 6, 2016 at 4:42 am
There appeared to be some confusion as to when your data end on the previous post. The reason is that you and Dr. Spencer do not plot things the same way. When Dr. Spencer labels an axis as 2015, he means January 2015. However when you label an axis as 2015, you apparently mean December 2015.
April 6, 2016 at 7:36 am
Yes, ‘apparently’ that’s what I mean. After all, that’s what I said in paragraph 3: “The graphs below start in December 1978, so the vertical gridlines denote Decembers. The final plotted points are March 2016.”
April 8, 2016 at 4:26 pm
[…] A Reality Check on Global Warming « The Pause Update: March 2016 (Preliminary) […]