Is Climate Change Threatening the Solomon Islands?

April 23, 2022

Since the first talk of an agreement between China and the Solomon Islands to establish a Chinese presence there, accusations have flown thick and fast between the Australian government and their opponents.

One of the points of contention is whether Australia’s supposed lack of urgency in addressing climate change has led to distrust of Australia by Pacific island nations, thus encouraging them to seek help from China.  Considering China’s record and plans for emissions, that is hardly likely.  However, The Guardian thinks so, saying two days ago:

There might not be a direct link between Australia’s climate policy and the security deal – Morrison certainly thinks there isn’t, dismissing such a connection as “nonsense” today – but it is without doubt that Australia’s climate policy has contributed to the dimming of Australia’s reputation in the region, especially given Australia claims to be family.

So is climate change – specifically sea level rise- threatening the Solomons?

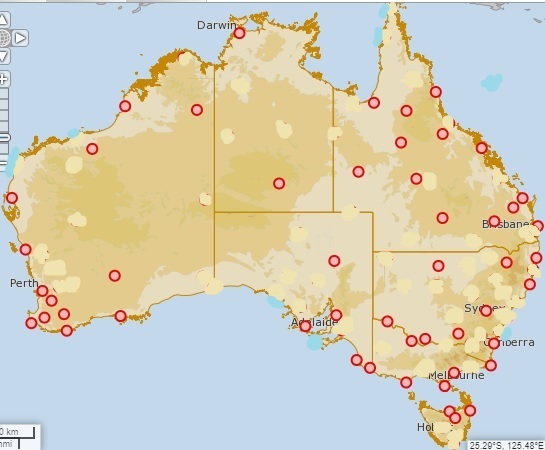
Time for a reality check.  Here is a map courtesy of Google, showing where the tide gauge in the Solomons is in relation to Australia.

Figure 1:  Solomons tide gauge location

Not that far away.

Over the last 28 years since the BOM began monitoring sea level at Honiara, sea level has definitely risen.  Figure 2 shows monthly anomalies of mean tidal data.

Figure 2:  Monthly mean sea level, Honiara

Oh no!  Climate change!

Figure 3 shows inverted mean barometric pressure anomalies plotted with mean sea level.

Figure 3:  Monthly sea level and barometric pressure (inverted)

Hmm.  As air pressure falls, sea level rises, and vice versa.  Figure 4 shows 12 month means (from July to June, which covers most ENSO events):

Figure 4:  12 month means of monthly sea level and inverted barometric pressure

Still not a close match, but let’s include the effect of the trade winds (data from NOAA).

12 month means of trade wind anomalies, scaled down by a factor of 10 show a much better match:

Figure 5:  12 month means of monthly sea level and scaled trade winds index

Now we see the connection, and cause of the apparent trend in sea level- the combination of air pressure and trade winds.  Barometric pressure has been decreasing, and trade wind strength has increased.  These are symptoms of the El Nino Southern Oscillation (ENSO).  When atmospheric pressure is unusually high (as in very big El Ninos), sea levels are lower, mainly because the normal trade winds slacken and less water than normal is pushed westwards across the Pacific.  As trade winds strengthen, more water is pushed westwards and sea level rises.  (This also affects the eastern coast of Australia, and strengthens the East Australian current as well.) 

When we get the next big El Nino (cue droughts, bushfires, and wailing and gnashing of teeth) it is likely that the sea level trend will mysteriously flatten.

Sorry, guys, unless climate change predicts fewer and weaker El Ninos, climate change is not to blame: and certainly not the Australian government.

It’s all about the money.

Gladstone Rejects Domestic Hydrogen

April 20, 2022

Gladstone Regional Council in Central Queensland has rejected a proposal to distribute a blend of 10% hydrogen and LNG from the Gladstone hydrogen park to residential and commercial customers.

The council received 100 submissions regarding the project.  All but one were against it, citing safety concerns.

The Australian Gas Infrastructure Group has been distributing a blend with 5% hydrogen through plastic pipes at Mitchell Park in South Australia since 2021 and is planning another hydrogen park to supply Albury-Wodonga in 2024.

Colorants and odorants are added to the blend.  The Gladstone plant was only to operate in daylight hours when solar power is relatively abundant.  Water was to be sourced from the Gladstone water supply.

With residents not convinced by safety assurances (the blend was to have twice the concentration of hydrogen as the South Australian scheme), it’s back to the drawing board for AGIG.

The future of Australia’s hydrogen industry is by no means assured.

Listen to the ABC Radio news item from 1:18.

More Problems With Australia’s Temperature Record: Part 3

April 13, 2022

We have seen in Parts 1 and 2 that every extra year of annual data can decrease the temperature trend at a weather station by from -0.02 to -0.03℃ per decade, and that less than half (47% actually) of Australia’s weather stations used for climate analysis have data from 1910, and three of them have insufficient data to calculate trends.

Figure 1 shows a map of non-urban Acorn stations with enough data to calculate trends, at 1910.  The others I have blanked out.

Figure 1: Acorn stations with data for 1910

The network is very sparse.  To estimate a national temperature for 1910 enormous weighting must be given to the values of a few remote stations like Alice Springs, Boulia and Kalgoorlie, so we hope they got the adjustments right!  Unfortunately, in 2015 I found adjustments at Kalgoorlie and Alice Springs were very problemmatic.

The Bureau explains the process of calculating average temperatures here.

Figure 2 shows the BOM map of trends from 1910 to 2020:

Figure 2:  Australian Tmean trends 1910-2020

Note that there a few “bullseyes” which surround stations whose temperature trends are out of phase with areas around them- e.g. Boulia is warmer, Marble Bar is cooler. 

Now here is a paradox.  As the years go by and more stations have data available, the area weighting for each station will decrease, however trends at the newer stations will show increased warming compared with the older ones.  However they will also have more variability.  This will result in oddities as I shall show, and reveals something of the difficulties with the BOM methods.

 Figure 2 is a plot of mean temperature from 1970 to 2020.

Figure 2:  Australian Tmean 1970-2020

The Acorn 2 trend is now +0.23℃ per decade or +2.3℃ per 100 years- a full degree more than the trend from 1910.

Now let’s look at the trend map for 1970 to2020:

Figure 3:  Australian Tmean trends 1970-2020

Note the little “bullseye” around Victoria River Downs, the little “balloon” around Halls Creek to the south-west of VRD, and the little surge to the south-southwest of VRD of 0.05 to 0.1℃ per decade.  Note also that north-eastern Arnhem Land, with no stations, has a warmer pocket.  Figure 4 is the BOM data for VRD.

Figure 4: Annual mean temperature at Victoria River Downs

VRD opened in 1965 and has too much data missing for BOM to calculate a trend.  The area weighting algorithm still gives it a cooling trend of between minus 0.05 and 0℃ per decade (Figure 3).  Que?

With more than 27% of data missing I wouldn’t calculate a trend either, but with only six of 43 years missing I can calculate a trend from 1978:

Figure 5: Annual mean temperature at Victoria River Downs

The trend is -0.09℃ per decade, which is a bit more cooling than the trend map (Figure 3) shows.  Now let’s look at trends from 1980 to 2020.

Figure 6:  Australian Tmean trends 1980-2020

There are more bullseyes, and I have shown temperature trends for some- Carnarvon, Meekatharra, Forrest, Thargomindah, and Gayndah.  But remember Figure 3’s little surge to the SSW?   It now has its own bullseye, and that is Rabbit Flat.

Figure 7: Annual mean temperature at Rabbit Flat

Rabbit Flat opened in 1970 and has a trend of +0.08℃ per decade, which agrees with the trend map in Figure 3.  Now from 1980:

Figure 8: Annual mean temperature at Rabbit Flat

What a difference a few years make in a short timeseries.  The trend of -0.06℃ per decade also agrees with the 1980-2020 trend map.

However, just 328km away Halls Creek shows a warming trend of +0.17C per decade from 1980 – 2020:

Figure 9: Annual mean temperature at Halls Creek 1980-2020

But from 1970 to 2020 Halls Ck is warmer still at +0.19C per decade:

Figure 10: Annual mean temperature at Halls Creek 1970-2020

And at Tennant Creek 441km away the 1970-2020 trend is +0.19C per decade:

Figure 11: Annual mean temperature at Tennant Creek 1970-2020

From 1980 it is +0.06C per decade.

Figure 12: Annual mean temperature at Tennant Creek 1980-2020

Temperatures are trending in different directions and wildly different rates at the closest stations: they can’t all be right!

The method of drawing trend maps is to use anomalies of temperatures of all years of all stations whether or not an individual trend can be calculated, then calculate a gridded average, and from that calculate trends, then spread those trends hundreds of kilometres in every direction- even across the Gulf of Carpentaria from Horn Island to Arnhem Land, as seen in Figures 3 and 6- averaged with the trends propagated by other stations.  If a site has data missing, the grid is infilled with the weighted data from other sites.  

In recent decades this causes great variability because of the short records, which leads to grave doubts about the reliability of some records.  Further back in time, there is less variability because there are more stations, and the longer records smooth and decrease the trends- however the weighting has to be much greater because of the large areas with no data at all for many years. 

The problem is: we can have either a long record, or an accurate record, but not both.

This leads to the obvious conclusion:

The official temperature record since 1910 is just a guesstimate.

More Problems With Australia’s Temperature Record: Part 2

April 10, 2022

My colleague Chris Gillham at WAClimate uses 58 long term weather stations for his analyses.

And with good reason.  Here’s why.

Figure 1 is a screenshot of the annual mean temperature record at a typical Acorn station, Longreach (Qld) with the linear trend shown.

Figure 1: Annual mean temperature at Longreach

The linear trend is +0.12℃ per decade.  Nine (9) of the 111 years of data from 1910 to 2020 are missing, leaving 102 years.

Australia’s official climate record is based on 112 sites like Longreach.  Of those, 8 are not used for seasonal and annual analyses because they are affected by Urban Heat Island (UHI) effect.  Five (5) of the non-urban stations have more than 20% of their data missing, so the BOM does not calculate trends for them. Of those remaining, only 50 started in 1910, and another 8 before 1915.  What is the effect of different length records on our understanding of how temperatures have changed over the years?

Figure 2 is a plot of the trends of mean temperatures per decade as a factor of the number of years of annual temperature data on record at those 107 Acorn stations with enough data to calculate trends.

Figure 2:  Trend as a factor of amount of data

Stations with  longer data records have lower trends.  The trends at stations with shorter records vary wildly, with some obvious outliers. 

At those stations with UHI effect, the relationship is even stronger.

Figure 3:  Trend as a factor of amount of data at sites with UHI

These sites are in larger towns and cities, possibly with better maintenance and observation practices (although not necessarily better siting).

The slope of the trendlines in the above two figures show that for every additional year of data, temperature trend decreases by about -0.02 to -0.03℃ per decade. In 100 years that could make a difference of as much as three degrees Celsius 0.3C at a well maintained site.

Figure 4 is a map of trends across Australia from 1910 to 2020.  I have shown the years of available data at each site (locations only approximate) and I have circled in blue those 5 sites that have insufficient data.

 Figure 4:  Years of data contributing to 1910 to 2020 trend map

Trends in different regions vary from less than 0.1C per decade to up to 0.3C per decade.  As you can see there is a large variation in the amount of available data in each different coloured band.  That’s for 1910 to 2020.  Note that there are only three (3) non-urban stations with no missing years- Carnarvon, Esperance, and Mt Gambier- which I have circled in red.  There are some big gaps.

In Part 3 I will look at some individual stations and how trends vary in the 51 years from 1970 to 2020.

More Problems With Australia’s Temperature Record: Part 1

April 8, 2022

Since 2010 I have been documenting problems with different versions of Australia’s official temperature record as produced by the Bureau of Meteorology (BOM).  Since the High Quality (HQ) dataset was quietly withdrawn in 2012 we have seen regularly updated versions of the Australian Climate Observation Reference Network- Surface Air Temperature (ACORN-SAT or Acorn).  We are now up to Version 2.2.  In this Part I shall show the effect of these changes on temperature trends.  In Part 2 I will show how record length affects trends, and in Part 3 I will look at the record since 1970 at some individual stations.

Figure 1 is from the BOM Climate Change Time Series page.

Figure 1:  Australian Official Temperature Record 1910 to 2021

The linear trend is shown as +0.13℃ per decade, or 1.3C per 100 years.  My colleague Chris Gillham of WAClimate has provided me with archived Acorn 1 annual mean temperature data to 2013 which allows this comparison:

Figure 2:  TMean: Acorn 1 and Acorn 2

The result of introducing Acorn 2 has been a much steeper trend:  Acorn 1 trend to 2013 was 0.9℃ per decade.  The trend has now become 0.13℃ per decade. (The extra 9 years have added an extra 0.017C per decade to the trend.)

Figure 3 shows when and how large the changes were:

Figure 3:  Difference between Acorn 1 and Acorn 2

Acorn2 is cooler than Acorn 1 before 1971 and warmer in all but three years since.  Since these were based on the same raw temperatures (with some small additions of digitised data and a couple of changes to stations) the changes were brought about entirely by adjustments to the data.

I calculated running trends from every year to 2013 for both datasets.  As trends shorter than 30 years become less reliable I truncated the running trends at 1984.  Figure 4 compares thre trends to 2013 of Acorn 1 and Acorn 2.

Figure 4:  Acorn 1 and Acorn 2 running trends per decade to 2013

The weather fluctuations of the mid-1970s to 1980s played havoc with trends.

Figure 5 shows the difference between the trends.

Figure 5:  Difference between Acorn 1 and Acorn 2 Trends

The difference ranges from +0.024C per decade for 1910 to 2013, to +0.039C for 1950 to 2013.  Having increased warming by from 0.25C to 0.4C per 100 years (just by making different adjustments) Acorn 2’s trend is much more alarming than Acorn 1’s.

Conclusion:

This is from the BOM’s explanation for Acorn:  

“A panel of world-leading experts convened in Melbourne in 2011 to review the methods used in developing the dataset. It ranked the Bureau’s procedures and data analysis as amongst the best in the world. ‘The Panel is convinced that, as the world’s first national-scale homogenised dataset of daily temperatures, the ACORNSAT dataset will be of great national and international value. We encourage the Bureau to consider the dataset an important long-term national asset.’” ACORN-SAT International Peer Review Panel Report, 2011.

 Acorn 1.0 was apparently such an important long-term asset that it was quickly superseded by Acorn 2 with a much more alarming trend.

What’s The Best Electric Vehicle For Me?

March 29, 2022

Pictured: Hundai Ioniq

So, you’re thinking about whether to get an electric car.  You’re worried about the cost of fuel, and you know you should be concerned for the environment.  Will it be practical for you?

Are you single, or have a partner but no kids, and live and work in the south-east of Queensland, or one of the other metropolitan areas of Australia?  If so, then you may take advantage of state subsidies and choose from a range of smaller EVs that may suit.

You have no doubt heard about the latest Queensland subsidy scheme:

“Queensland offers $3,000 subsidy to EVs priced under $58,000, excludes Tesla”

Unfortunately this policy is pure political window dressing, and is deliberately aimed at metropolitan voters (not necessarily drivers), as the only cars that can theoretically be of practical use outside Brisbane are outside the scheme.  Unlike other states, Tesla, the car best suited to roads outside the suburbs, is specifically excluded.

The Queensland government said that cars that will qualify for the rebate include the Nissan Leaf, the MG ZS EV, the Hyundai Ioniq, the Hyundai Kona, the new Atto 3 model being released by BYD, and the Renault Kangoo.

Never mind, I’ll attempt to list the pros and cons of a range of vehicles, including Tesla.

Car Base priceClaimed Range
Hyundai Ioniq$49,970311km
Hyundai Kona$54,500305km
Nissan Leaf   $49,990270km
MG ZS EV  $40,990263km
Renault Kangoo $50,290?
Atto 3  N/AN/A
Not subsidized in Qld
Tesla Model 3$59,900491km
Tesla Model S$162,559652km
Kia EV6$62,990484km

Remember that these prices do not include on-road costs.  However, with the subsidy taking $3,000 off the base price of the smaller ones, they are within reach of many people.

If you are serious, you should check reviews at reputable sites such as carsguide. Here most are described as, for example, “easy-going, comfortable, and has plenty of range to work with for city drivers, so charging doesn’t become much of an inconvenience…” (the Nissan Leaf).  They are nice small cars, ideal for the city.  Except the Kangoo.  It’s a van.

If you sometimes escape the city, for example to the Sunny Coast, beware.  The range shown above may not be achieved in practice.  You will need to plan your trip very carefully including possible recharging stops.  At a 50 kW DC charger, you will need from 45 minutes to just over an hour to charge from 20% to 80% of battery capacity.  Well, I suppose you could have lunch while you wait, but the Cooroy train station with its one 50 kW chargepoint might not be your desired destination.  And why 20% to 80%? Apart from not wanting to be stranded with a flat battery (“range anxiety”) you should be aware that lithium ion batteries degrade if the charge is allowed to be above or below these levels too often or too long.  So to protect your battery, the vehicles able to get the subsidy will have a range between charging of from 180km (the MG) to 290km (the Kona)- maximum.  Keep your wits about you.

You can also recharge at home of course, where charging times can be from 6 hours for the Kona, to 25 hours for the MG, to “up to 60% overnight” for the Leaf.  Oops.

If you have a family, or if you live outside the south-east corner of Queensland or other metropolitan area, or if you would like to take a road trip from time to time, none of these vehicles are for you.  They are too small for a family, have limited luggage space, and limited range.  No subsidy for you.

The cheapest EV option would be the Tesla Model 3, at $59,900, plus on road costs.  For that you get a beautiful car that will fit a small family, with a range of 491km (or 296km if you want to protect your battery). More options will cost $84,900, for a range of 614km (or 368km if you want to protect your battery).  It will take 60 minutes to charge at a fast charger, but if you charge at home the quoted figure is “10km per hour”.  And at the moment in Queensland Tesla has superchargers at Brisbane, Gold Coast, Maroochydore, Toowoomba, and Gympie.  One is planned for Rockhampton- but you might not get to Rockhampton from Gympie (467km).    Wider travel in regional areas is out of the question unless you use much slower recharging stations.

If you have a spare $162,559 plus on road costs you could buy a Tesla Model S, with a range of from 637km to 652km which means you could get from Brisbane to Rockhampton in one go (theoretically) if you started out with 100% charge.  But you should know that an EV performs worse on the highway, and the stated range is the upper limit on a full charge on average- so I would still recharge at Gympie, taking from 40 to 60 minutes.

Another option is the Kia EV6 ($62,990 to $82,990) with a range from 484km to 528km (290km to 317km if battery saving), but you will still need recharging stops of over 70 minutes.  Fortunately there are charging stations at Cooroy, Gympie, Maryborough, Childers, Miriam Vale, and Rockhampton (and all the way to Cairns).   If you wish to go west they are at Gatton and Toowoomba.  Another 18 are planned in the inland.

Existing and planned charging stations in southern Qld

I drive a Hyundai Tucson.  I can easily drive between Rockhampton and Brisbane (621km) on one tank, with 100km of range to spare.  With rest stops it usually takes well under 8 hours.  If we do choose to refuel on the way it takes about 15 minutes.  The 2022 price is $36,500 plus on road costs.  That is still $1,490 cheaper than the smallest of the subsidized vehicles (the MG- which would need three or four recharging stops, and is still $16,000 dearer than the petrol MG, even with the subsidy.) At my average economy of 7.5 litres/100km, petrol at $2.10 a litre, and including service charges it would take 4 years and 4 months for the cheaper Tesla 3 to be better value than a Tuscon- and it would need at least two recharges to go 621km .

Now, about emissions.  The only benefit to the environment of an EV is less exhaust fumes in the city.   Unless you are completely off grid with solar panels and batteries, no matter where or when you recharge your emissions will be no less and no more than the whole electricity grid- and if you recharge at night there is no solar.  An EV is just another (expensive) electrical appliance.

Your choice (for now).  But I won’t be going electric.

Is Australia Getting Harder To Live In?

March 23, 2022

Update: see link below kindly supplied by Big M

According to Scomo it is.

And are natural disasters becoming worse and more frequent?

If you listen to or look at commentary in the mass media and social media, largely fuelled by politicians and journalists with no contact with nature and no life experience, you might think so.

The Conversation says:

It’s too soon to say whether the current floods are directly linked to climate change. But we know such disasters are becoming more frequent and severe as the climate heats up.

Time for a reality check.

Flood and fire and famine are the three great normals of Australia, as so well expressed by Dorothea McKellar in My Country, and we in the north also have cyclones.   

First, floods.  Brisbane was hit hard by floods last month.  Figure 1 is from a previous post, showing historic floods in the Brisbane River with the 2022 flood inserted.  No cause for alarm there.

Figure 1: Historic Brisbane Flood heights 

What about fatalities?  Figure 2 shows the 2022 floods compared with some historic floods from all over Australia.  Fatalities are totalled if several floods occurred in one year.

Figure 2:  Death tolls of flooding events

Are flood disasters getting deadlier? No.

Fatalities and housing damage are the result of people living in flood prone areas- or from being trapped in vehicles in rising waters.   After the 1916 flood, the people of Clermont in Queensland moved their town to higher ground- without any government assistance.  This photo from Bonzle shows the Commercial Hotel being moved on log rollers by a steam traction engine.  The Commercial is still standing- I’ve had a few coldies there.

Figure 3: Moving the Commercial Hotel to higher ground

And no one asked where Billy Hughes was.

What about fires?

Figure 4 shows the area of land burnt by bushfires by notable fires across Australia.  I have marked some fires that are fairly well known- but does anyone mention the fires of the 1960s and 1970s?  These were in largely savannah country of WA, Queensland, and the NT.

Figure 4:  Area Burnt by Bushfires

Figure 5 shows fatalities due to bushfires.

Figure 5:  Bushfire Fatalities 1920-2020

Despite the terrible 2009 fires, fatalities due to bushfires in the last 100 years have been trending down.  Lessons must be learned from these tragic events.  We should remember that fire is part of the Australian bush.  Many fatalities occur where housing is surrounded by bushland, with poor escape routes.

The downtrend in fire fatalities is even more apparent when you consider Australia’s population has grown enormously since 1920.  The following plot shows how the risk of death by bushfire has changed.

Figure 6:  Bushfire Fatalities per 1,000 people 1920-2020

No, by no measure are bushfires getting worse, or making Australia harder to live in.

Droughts are also in decline across most of Australia.  The following plots use BOM data.

Figure 7:  Percentage of Land in Severe Drought (lowest 10% of rainfall)

Even though 2019 was an extremely dry year, over 120 years the area of land in drought is decreasing at the rate of 0.23% per decade.

The only areas where drought has increased are Southwestern Western Australia, Victoria, and southern South Australia. 

In southern Australia as a whole, there is no trend in droughts, even with the 2018-2019 drought.

Decadal averages are an excellent way of showing long term patterns.  In southern Australia the worst period of long lasting dry years was the 60 years from 1920 to 1980.

Figure 8:  Percentage of Land in Severe Drought- Decadal Averages Southern Australia

But are dry periods getting drier, and wet periods wetter?  And are dry areas getting drier, and wet areas wetter?  Here are long term rainfall records for Sydney, Cairns (very wet) and Alice Springs (very dry), and Adelaide (drying trend) again with decadal means.  Values are anomalies from months of overlap of weather stations, in millimetres of rain.

Figure 9:  Decadal Mean Rainfall- Sydney

The three major droughts stand out, as does the major reset of the 1950s.  Note the decreasing values to the 1940s, and again from the 1960s.  There is no indication of wet periods getting wetter and dry periods drier.

Figure 10:  Decadal Mean Rainfall- Cairns

Figure 11:  Decadal Mean Rainfall- Alice Springs

It seems that dry periods are getting wetter at Cairns and Alice Springs, and apart from the 1970s-1980s, wet periods show no great difference.

Figure 12:  Decadal Mean Rainfall- Adelaide

Here we see the gradual fall off in rainfall in southern SA, gradually since the 1930s but more rapidly since the 1970s.  The shift in the Southern Annular Mode has caused drying in southern parts of the continent.  It is too early to draw any conclusions from that.

The alternately wet – dry feature of Australian climate is obvious from all the above plots.  However, wet periods are not getting wetter, and dry periods are not getting drier.

What about cyclones?  Here is a plot straight from the Bureau:

Figure 13:  Tropical Cyclones 1970-2021

Cyclones are NOT becoming more frequent or more severe.  The trend is clearly downwards.

Finally, heatwaves.  In reality we have no idea, as the temperature record managed by the Bureau is so bastardised- as shown here, here, here, here, here, and here.  We just don’t know, no matter what they claim.

Those who live in the cities, who have little contact with nature, and who have no knowledge of the history of Australia’s climate, will accept whatever they’re told about natural disasters as gospel.  The truth is different.

Scomo has nothing to worry about (apart from the next election).  Australia is NOT getting harder to live in: floods, fires, droughts, and cyclones are NOT getting worse or more frequent. 

UPDATE: Big M has kindly supplied this link, which I missed.

https://www.abc.net.au/news/2021-05-26/australias-hidden-history-of-megadroughts/100160174

The 1760s WA drought seems to match data from the Barrier Reef showing a 30 year drought in NQ.

Why Is Business Investment Sluggish: An Alternative View to Alan Kohler

March 8, 2022

On ABC News on Sunday night, Alan Kohler in his regular spot showed how business investment, especially in plant and equipment, has  been sluggish for the past several years.  Despite acknowledging a number of theories, of course he blamed it on the lack of a coherent bi-partisan climate policy- his favourite hobby-horse.

Time for a reality check.

Firstly, Figure 1 shows the Australian All Ordinaries Index with the key dates of proposal, adoption, deferral, re-proposal, and eventual scrapping of all versions of carbon tax, with the 2014 and 2019 elections when Labor’s climate dreams were roundly rejected.  It is important to realise that various Federal and State renewable energy incentives have also been introduced during this time.

Figure 1:  All Ordinaries Index 2007-2022 (per Westpac)

The share market seems to have been largely oblivious to climate policy.  What about business investment?

I checked the recently released ABS data, here and here.

Alan Kohler used 3 data points (decadal annual growth rates).  I looked at the 124 quarterly values of private investment in 2021 dollar values, from March 1991 to December 2021.

Figure 2:  Quarterly Private Capital Investment, 1991-2021

While Construction boomed from 2011 to 2015, it is true that investment in plant, equipment, and machinery has barely moved since 2010.

These categories can be further broken down into Mining and all others except for mining:

Figure 3:  Capital Investment in Construction, Mining and Non-mining

That big bump was the mining boom, which also shows but to a lesser extent in investment in Plant and Equipment:

Figure 4:  Capital Investment in Plant & Equipment, Mining and Non-mining

Note that the total figure for Plant and equipment is nearly all from non-mining activity.  Note the peak was reached in the December quarter of 2009, before the big reduction brought about by the GFC of 2008 and 2009.

Rather than annual growth or actual quarterly investment, an alternative comparison is with GDP.

Figure 5:  Australia’s Gross Domestic product

Despite the sluggish early 1990s, the GFC and the pandemic, GDP has been growing at an increasing rate, especially in the last five years.

Figure 6:  Quarterly Private Capital Investment as a percentage of GDP, 1991-2021

Mining investment in construction has been huge, and the economy has been reaping the benefit since 2016. 

Figure 7 shows investment in plant and equipment (which Alan Kohler says has been flat since 2011 as a result of not having certainty in climate policy) outside the mining industry.  The dates from Figure 1 are shown.

Figure 7:  Quarterly Plant and Equipment Investment as a percentage of GDP, 1991-2021

Alan Kohler’s explanation is obviously wrong. Perhaps he could explain why plant and equipment expenditure relative to GDP has been steadily decreasing since 1996- well before any mention of climate policy.  That would seem to be a much more serious problem.

But I don’t think he will- there’s an election coming up.

How Unusual Is All This Rain We’ve Had?

March 3, 2022

Yesterday, 2nd March, ABC weather reporter Kate Doyle posed this question on the ABC website about the recent rain event in SE Queensland and Northern NSW.

Her answer to the above question was:

Very unusual.

The rainfall totals from this event have been staggering. 

From 9am Thursday to 9am Monday three stations recorded over a metre of rain:

– 1637mm at Mount Glorious, QLD 
– 1180mm at Pomona, QLD
– 1094mm at Bracken Ridge “

She goes on to say:  “South-east Queensland and northern NSW are historically flood prone and have certainly flooded before but this event is definitely different from those we have seen in the past.”  And of course climate change is involved.

Time for a reality check. 

My answer to Kate’s question:  Not very unusual at all.

I went looking at Climate Data Online for four day rainfall totals over one metre, to compare with the recent totals above at Mount Glorious, Pomona, and Bracken Ridge. 

For a start, Pomona’s BOM station has been closed for years, and Bracken Ridge is not listed at all, so those reports are from rain gauges external to the BOM network and can’t be checked. 

That’s OK.  In about half an hour I found the following four day rainfall records.

Crohamhurst4/2/18931963.6mm
Yandina3/2/18931597.8mm
Tully Sugar Mill13/02/19271421.3mm
Palmwoods4/2/18931244.6mm
Buderim3/2/18931150.3mm
Bloomsbury20/01/19701141.8mm
Dalrymple Heights6/04/19891141mm
Innisfail3/04/19111075.8mm
Nambour11/1/18981013mm

1893 was a wet year!  Crohamhurst had 2023.8 in five days, and Brisbane had three floods in two weeks in February and another in June.

And there is no such thing as a “rain bomb”, a term invented to make it sound unprecedented.  This was an entirely natural and normal rain event.  Slow moving tropical lows drift south every few years in the wet season, producing a large proportion of Queensland’s average rainfall.

Floods have affected Brisbane and surrounds since before European settlement.  The Bureau has an excellent compilation of accounts of past floods at

http://www.bom.gov.au/qld/flood/fld_history/brisbane_history.shtml

It includes this graphic showing the height of known floods.  I have added an indication of the height of the 2022 flood.

Here are some notable Brisbane floods:

1825       a flood probably as high as the 1893 flood

1841       8.43m

1844       about1.2 metres lower than 1841

1864       ?

1887       ?

1889       ?

1890       ?

1893       8.35m

“              8.09m

“              ?

“              ?

1908       4.48m

1974       5.45m

2011       4.46m

2022       3.85m

Every flood is different- water backs up higher in unexpected places, or gets away faster, so for many people this flood was worse than 2011.  However it is beyond any doubt that this flood, heartbreaking as it was for many people, could have been much worse.  It was nowhere near as big as several in the past.  Wivenhoe Dam worked as planned this time, which greatly lessened the impact.

Another thing worth remembering:  floods were more frequent and higher in the 19th Century than they have been in the last 100 years.

ABC journalists need to do a lot more research.

Covid in Context: the Eastern States

February 3, 2022

In this post I am looking at the pandemic experience across New South Wales, Victoria, Queensland, and South Australia, since the Queensland border was opened on 17 December 2021.  Tasmania, the Northern Territory, and the ACT are excluded because their numbers so far are too low for useful analysis, and WA of course is still a hermit kingdom.

I use data from the excellent site, Covid-19 in Australia

That site has excellent comparative charts, however I wanted to pick up on some points which are not so clear.

For some time Chief Health Officers have been warning that case numbers are a poor metric of Covid infections.  Here’s why:

Figures 1 to 4 show 7 day running means of reported daily positive cases of Covid-19 for each state.

Figure 1:  Queensland cases

Figure 2:  New South Wales cases

Figure 3:  Victorian cases

Figure 4:  South Australian cases

Notice that the high point for all states was reached at about the same date, and cases in all states plummeted after the 20th January.  (Victoria plummeted from the 15th.)  All states gave up trying to keep up with the testing demand and Rapid Antigen Tests were as rare as hens’ teeth.

Case numbers we can then ignore:  they may be two, three, or more times higher.

A better metric will be the  seven day rolling mean number of people in hospital, in Intensive Care, or dying.

Figure 5:  Queensland daily numbers in hospital

Hospitalisations peaked on Australia Day and are slowly falling.

Figure 6: NSW daily numbers in hospital

In NSW there was no distinct peak but hospitalisations have been gradually falling since 25 January.

Figure 7:  Victoria daily numbers in hospital

Victoria’s peak was on 21 January.

Figure 8:  South Australia daily numbers in hospital

South Australian hospitalisations stopped rising on 25 January with a slow fall since.

Figure 9:  Queensland daily ICU and mortality numbers

Although Qld hospitalisations have declined, ICU numbers have remained at about 50 for two weeks.  Deaths are also plateauing.

Figure 10:  NSW daily ICU and mortality numbers

Despite a fall in the number of ICU patients, deaths are high, and it is still too early to see a peak.

Figure 11:  Victoria daily ICU and mortality numbers

There is a similar situation in Victoria.  While ICU numbers have fallen, deaths have plateaued over the last six days.

Figure 12:  South Australia daily ICU and mortality numbers

Only in South Australia do we see a distinct fall in deaths, with a corresponding fall in ICU numbers.  Let’s hope this continues.  However, it is possible there is something different about the data reporting.

Across these states there appears to be a delay of from 7 to 10 days from the suspected peak in case numbers to hospital admission, and 14 to 16 days from peak in cases to death.

Of those admitted to hospital, the chance of going into ICU is:

Queensland:      1 in 17

NSW:                1 in 15

Victoria:            1 in 9

Sth Australia:    1 in 5 – 6

Once in ICU, the chance of dying is:

Queensland:      1 in 4 -5

NSW:                 1 in 6

Victoria:             1 in 5

Sth Australia:     1 in 8

In Queensland, based on official case numbers, an individual testing positive (all ages and all vaccination states) has a 1 in 20 chance of being sick enough to go to hospital; 1 in 345 of being admitted to ICU; and 1 in 1,500 of dying.  (For healthy, fit individuals under the age of 60 the chances will be considerably smaller.)

Conclusion 1:  In these four states, we are almost over the worst, and the health systems have managed to cope (albeit with leave being cancelled and great stress on staff). 

Conclusion 2:  Covid-19 loves people to live in big cities, or to live in crowded conditions, or to have lowered immunity and chronic health conditions, or to be elderly.  Nursing homes fit those last three conditions nicely. Many nursing home inmates also have Advanced Health Directives, many probably stipulating they do not wish to have resuscitation or ventilation. A high death toll in nursing homes is to be expected with a highly transmissible and nasty flu like Covid.