In recent weeks Jennifer Marohasy has demonstrated that the BOM’s preferred method of temperature measurement (its Automatic Weather System, AWS, of probe and data logger) delivers temperatures that are often substantially different from the old Liquid In Glass (LIG) thermometers at the same times in the same Stevenson screen at Brisbane Airport.
The BOM has denied this, as reported in The Guardian:
Plummer says it also aligns with the warming seen in the ocean around the continent, and with “18 other independent data sets around the world, including from satellites looking at the lower atmosphere”.
In one paper, Ayers, who left the bureau 13 years ago, compared the Acorn-Sat warming trend with four other international data sets that use weather balloons, satellites and raw data from the bureau. In all cases, Ayers found a comparable warming trend.
Following from my much older posts in 2015, 2021, and 2022, here is another way of showing how the BOM’s temperature record has thus diverged from reality.
I use the Bureau’s Acorn monthly Tmax data for Australia, their monthly rainfall data, and satellite data for Australia from UAH (the University of Alabama- Huntsville), for the period from December 1978 to March 2023.
I have recalculated Tmax and rainfall anomalies from 1991 to 2020, the same period as the UAH dataset.
Of course, the BOM and other Global Warming Enthusiasts will insist that Acorn and UAH both show similar warming since 1978, and they are (mostly) right, as Figure 1 shows:
Figure 1: Monthly Surface Tmax and Atmospheric Temperatures from UAH
A scatterplot of Acorn Tmax against UAH shows they are “roughly” similar:
Figure 2: BOM Tmax vs UAH
There is correlation, but there are many differences.
As I showed back in 2015, the relationship between Tmax and UAH is governed by rainfall. Figure 3 shows how closely the difference between surface Tmax and atmospheric (UAH) temperatures follows inverted rainfall. I have smoothed the data with a 12 month running average.
Figure 3: 12 month running averages, Tmax minus UAH and Inverted Rainfall
Note the close match! Yet you may also note that before about 1998 the inverted rain value is often above the difference value, while after about 2012 it is mostly below. This implies that the relationship between Tmax and UAH has changed. Which is at fault?
Figure 4 shows the running 120 month correlation between the Tmax-UAH difference and rainfall:
Figure 4: 120 Month Running Correlation between Tmax-UAH Difference and Rainfall
Note that better correlation is at the bottom (closer to -1). The best correlation is in the 10 year period to February 2015. Figure 5 plots the Tmax-UAH difference against rainfall for that period:
Figure5: Rainfall as a factor of the BOM-UAH difference
The equation for the trendline is
Tmax – UAH = (-0.0339 x Rainfall) + 0.1546
So,
Tmax = (-0.0339 x Rainfall) + 0.1546 + UAH
This allows us to calculate an approximation of what the surface Tmax should be for given rainfall.
Figure 6: Monthly Tmax and Theoretical Tmax
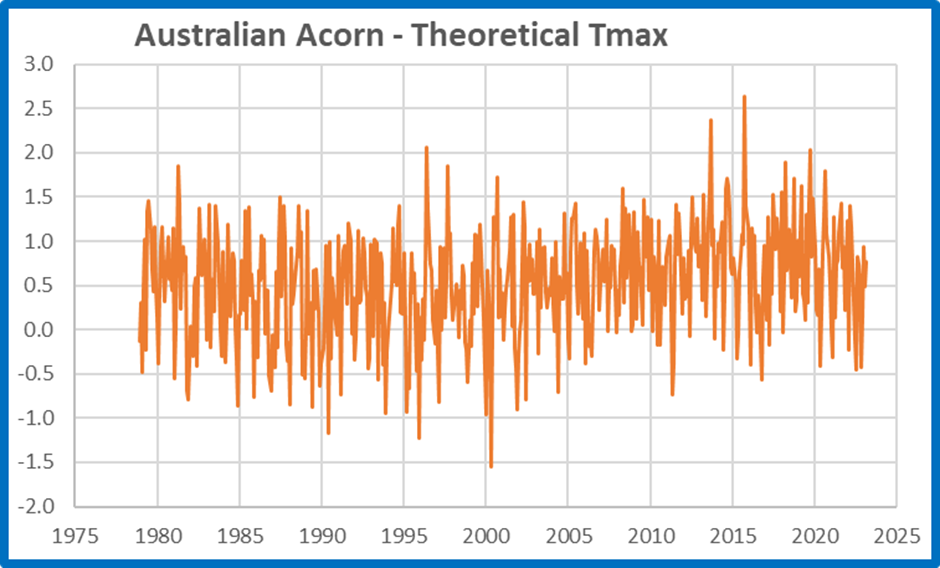
Similar, but slightly different. Figure 7 shows the difference:
Figure 7: Tmax minus Theoretical Tmax
The 12 month running mean may help show how the relationship changes:
Figure 8: Tmax minus Theoretical Tmax 12m Averages
No difference is zero. Clearly the official Acorn TMax is too high, and much too high in the last few years- roughly 0.4C to 1C higher than what would be expected given rainfall and atmospheric temperatures recorded by UAH.
The reason? The Bureau’s AWS data collection increased from the 1990s. Before 2000 adjustments have been increasingly applied to original LIG temperatures to match.
The Bureau of Meteorology’s Tmax dataset is a crock.
Tags: Acorn, Australia, bom, Bureau of Meteorology, temperature


May 9, 2023 at 6:33 am
Hi Ken, Great analysis! But I would love a plain English summary of your conclusions. By how much do you estimate the probes in AWS are over estimating?
May 9, 2023 at 6:48 am
Hi Jen
As I said, that’s an approximation of what Tmax should be. So across all 104 Acorn stations across Australia it looks like Acorn Tmax could be 0.4C to 1C more than expected in the last decade or so. See my update to the post above.
May 9, 2023 at 7:28 am
That’s on a 12 monthly average. Monthly differences are very much greater (-0.6C to +2.6C in 2015).