Update 2 February 2015
Rereading this, I just noticed a stupid error: I had said Brisbane’s Acorn trend is less than its neighbours’ Acorn trend, but it is actually more- as with the other outliers.
In my previous posts I showed how the Acorn adjustments to the ‘raw’ minimum temperature data have the effect of enormously increasing the apparent trend across the whole network, and very differently in different regions. In this post I am looking more closely at the six locations where the adjustments cause a change in trend of greater than +2 degrees Celsius. These are: Brisbane Airport, Amberley RAAF, Dubbo, Rutherglen, Rabbit Flat, and Carnarvon.
And I am mystified.
The purpose of homogenisation adjustments is to remove discontinuities in data, which show up as differences between the ‘candidate’ site’s record and those of its neighbours, the ‘reference’ sites. The Acorn method of detecting discontinuities uses pairwise comparison with up to 40 neighbouring sites, and this includes sites many hundreds of kilometres distant. Adjustments are made with a Percentile Matching algorithm which compares with up to 10 neighbouring sites.
I use my own method to compare sites with neighbours. When comparing any sites, anomalies from a common base period (1961-1990) are used. Only sites with data (at least 15 years) in this period can be used. Sites also need long data records. While in closely settled areas there will be a selection of observation sites, very few meet these requirements. Therefore I compare the data of each of these six locations with those of their nearest surrounding Acorn sites’ ‘raw’ data, (adjusted by me only when necessary to create a long combined series), individually and with their mean.
Even with only five neighbours, for Carnarvon and Rabbit Flat these can be over 500km away.
I then repeat this using Acorn (adjusted) data for the neighbours.
The results are surprising.
Here are the six outliers and their surrounding Acorn neighbours:
Note the remoteness of Rabbit Flat and Carnarvon.
Results:
Brisbane Air
Fig. 1a: Brisbane ‘raw’ spliced vs Acorn minima
The neighbours are: Amberley, Cape Moreton Lighthouse, Bundaberg, Gayndah, Miles, and Yamba Pilot Station.
Fig. 1b: Brisbane raw vs mean of neighbours (‘raw’ data)
Fig. 1c: Brisbane Acorn vs neighbours’ raw mean
Note the adjusted trend (+1.95C per 100 years) is greater than the mean of the neighbours (+1.06) by nearly +0.9C.
Fig. 1d: Brisbane Acorn vs mean of neighbours (Acorn, adjusted data)
As you would expect, the data are now very similar, and the trend for Brisbane is thus 0.23C per 100 years more than the trend for the mean of the neighbours’ Acorn data.
Amberley
Neighbours are the same as Brisbane’s, including Brisbane, 50km away.
Fig. 2a: Raw vs Acorn
Fig. 2b: Amberley and mean of neighbours (raw).
Fig.2c: Amberley Acorn vs neighbours mean (raw)
Note the trend is more than one degree steeper than the trend of the neighbouring Acorn sites’ raw data.
Fig. 2d: Amberley Acorn vs neighbours’ mean (Acorn)
Amberley’s adjusted trend is +0.87C greater than that of the mean of its neighbours’ adjusted data.
Dubbo
Neighbours are: Gunnedah, Scone, Bathurst, Cobar, Wyalong
Fig. 3a: Raw vs Acorn
Fig. 3b: Dubbo and mean of neighbours.
Fig.3c: Dubbo Acorn vs neighbours mean (raw)
+1.47C difference.
Fig. 3d: Dubbo Acorn vs neighbours’ mean (Acorn)

Now only +1.29C per 100 years greater than the neighbours.
Rutherglen
Neighbours are: Deniliquin, Wagga Wagga, Sale, Kerang, Cabramurra
Fig. 4a: Raw vs Acorn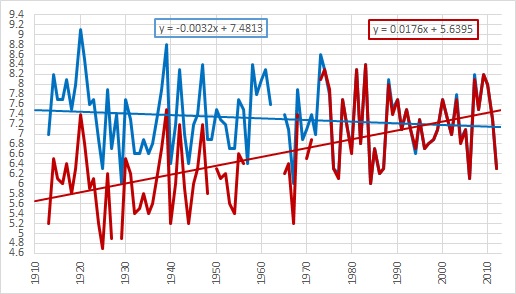
Fig. 4b: Rutherglen raw and mean of neighbours (raw).
Note that Rutherglen’s cooling trend is only 0.3C different from that of its neighbours.
Fig.4c: Rutherglen Acorn vs neighbours mean (raw)
Fig. 4d: Rutherglen Acorn vs neighbours’ mean (Acorn)
+0.51C per 100 years greater than the neighbours.
Rabbit Flat
Rabbit Flat is a roadhouse in the Tanami Desert on the track between Alice Springs and Halls Creek. Climate Data Online shows the current Rabbit Flat site 015666 as being 71km away from the old closed site 015548, though the Acorn Station Catalogue says it’s only 200 metres. This in itself is peculiar.
The nearest non-Acorn site is Balgo Hills 211 km away.
Acorn neighbours are: Giles (567km), Halls Creek (328km), Victoria River Downs (433km), Tennant Creek (440km), and Alice Springs (568km).
Fig. 5a: Raw vs Acorn
Fig. 5b: Rabbit Flat and mean of neighbours (raw).
Fig.5c: Rabbit Flat Acorn vs neighbours mean (raw)
+1.17C more warming than neighbours.
Fig. 5d: Rabbit Flat Acorn vs neighbours’ mean (Acorn)
Rabbit Flat adjustments give it a trend +0.75C more than the neighbours’.
Carnarvon
Carnarvon’s Acorn neighbours are Learmonth (298km), Wittenoom (560km) , Meekatharra (524km), Geraldton (447km), and Morawa (538km). The only non-Acorn site with continuous data for the early part of last century is Hamelin Pool 6025 (174km away).
Fig. 6a: Raw vs Acorn
Fig. 6b: Carnarvon and mean of neighbours (raw).
Now note the effect of just one of the neighbours- Morawa.
Fig. 6c: Carnarvon raw vs neighbours’ mean excluding Morawa
Note the much closer comparison.
Fig.6d: Carnarvon Acorn vs neighbours mean (raw) (including Morawa)
Note the trend is +1.58C per 100 years more.
Fig. 6e: Carnarvon Acorn vs neighbours’ mean (Acorn)
The difference is +1.49C.
The Acorn trend at Carnarvon is also greater than the Acorn trends at each of the neighbours separately.
Conclusion: –
The Acorn adjustment algorithm creates homogenised data by comparing with up to 10 neighbouring sites. I have shown that the adjustments have made the Acorn trends greater than, not only the raw data trends for each site, not only the raw data trends of the closest neighbours in the Acorn dataset, but in every case but one, greater even than the trends of Acorn homogenised data from the same neighbouring locations. The adjustments created thus appear to be spurious and the algorithm faulty.

July 17, 2014 at 11:01 am
Great work!
Bottom line message IMHO – don’t believe any claims based on “High Quality Data” or “ACORN”. The homogenisation process is a flawed method – at least as complimented by NOAH.
Pairwise comparisons of annual means for each station is much safer technique. “Is this year for location X hotter than last year?”. One or two relocations of a particular station will have little effect on the mean of the pairwise comparisons.
The Homogenisation approach relies on the idea “It’s too complex for you to replicate, so just trust us!”
July 18, 2014 at 3:18 am
Ken you have exposed the naked truth again!
Interesting to see the effect of site moves. I note for Halls creek old and new the difference in both raw mins and raw max.. With the new one being warmer in the overlap years. There does seem to have been some cyclic warming but the truth is nothing like that Rabbit Flat Acorn line. As usual the hottest years on both records were a long time ago. 1906 and 1992. So much for this century being more extreme.
July 21, 2014 at 3:16 am
I think that the ACORN algorithm is an outstanding success. Over a hundred years, declines in temperature are consistently converted into increases. Graphs that went down now go up. Claims based on raw data observations that it was as hot or hotter a hundred years ago are, according to the adjusted data, now without foundation. There is another added benefit. In the period 200 to 2010, declines in temperature shown by the raw data, are converted by ACORN into continued rising temperatures – more evidence of dangerous warming. The so-called hiatus of the deniers has been magically crushed like a nut by the sledgehammer of ACORN. Now who are the luminaries in BOM that are responsible for all this good work? Names please.
July 21, 2014 at 8:30 am
Of course Oksanna, if want CAGW then it’s easy, Just add 2 degrees C to all the raw data and Bingo there it is. Of course that doesn’t make it real, But I imagine that won’t bother you..
July 21, 2014 at 12:42 pm
I think Oksanna is being sarcastic, Paul 😉
July 21, 2014 at 4:43 am
We must remember that those responsible for the data adjustments are trained professionals, they can adjust data in a a way that’s not possible for ordinary citizens…
July 21, 2014 at 5:16 am
Ken, great work, I know how long it takes looking at the raw data, I have been looking at some in the USA.
You could really do with talking to Steve Goddard at
http://stevengoddard.wordpress.com/
as he has ben finding almost identical “Quality Control” adjustments of the US temperature data.
For instance see this
http://stevengoddard.wordpress.com/2014/07/20/something-seriously-wrong-at-ushcn/
July 21, 2014 at 9:09 am
I am speechless at the magnitude of these “adjustments”. If I worked at the BOM I’d be ashamed to admit it.
Great work by the way. Very great effort in shining a light on this.
July 21, 2014 at 12:42 pm
Scammers are never ashamed of their work … it stands as a beacon to their peers.
July 21, 2014 at 9:45 am
Well, not only appears to be. It is ! you need more proof ? As Steven has shown, the goes with US data, and given these two sets use of adjustments, be assured it the same all over.
July 21, 2014 at 12:20 pm
Thanks for all your work. Keep going. Data trumps everything and will win in the end.
July 21, 2014 at 12:24 pm
“Rutherglen
Neighbours are: Deniliquin, Wagga Wagga, Sale, Kerang, Cabramurra”
Rutherglen is an inland low lying city in Northern Victoria. Cabramurra is the highest permanently inhabited town on the Australian continent, situated at 1,488m AHD in the western Snowy Mountains of the Great Dividing Range, in the state of New South Wales.
Sale is a coastal town in Sth’n. Vic.
You would be hard pressed to find three towns with less similar climates. How on earth any one of these could be a proxy for the others defies imagination.
July 21, 2014 at 4:07 pm
I know. Normally I wouldn’t include Sale and Cabramurra. But Acorn appears not to discriminate between neighbours, all well correlated records are considered, so I followed suit. However, anomalies show their records are indeed fairly comparable, although Kerang is the outlier (low)1910-1955.
July 21, 2014 at 4:47 pm
Ken, my comments were directed at BOM / Accorn not you.
July 21, 2014 at 4:55 pm
Ken, a further thought. Even if these 3 towns often, usually, nearly always have similar temps, which I doubt, anyone who knew the geography of their respective areas would realise those outcomes were flukes and would never think of using them as proxies for each other. Sale is close to the Gippsland Lakes area which boasts a very mild climate quite unlike Rutherglen of Cabramurra
July 21, 2014 at 4:56 pm
Oops, should be or Cabramurra
July 21, 2014 at 2:32 pm
Ken,
It looks like you and Steve Goddard have found a global trend of land temperature adjustments causing warming that is not justified by the raw data.
http://stevengoddard.wordpress.com/2014/07/20/quick-summary-of-ncdc-data-tampering-forensics/
July 21, 2014 at 2:52 pm
Thanks for the work and effort Ken. As a long time JoNova reader and an amateur I really appreciate the efforts you have all put in. And without a government grant!!!!
July 21, 2014 at 2:56 pm
Have you thought about contacting a minister about these Ken?
I know your efforts to get anything at the BOM have been stifled, maybe a govt minister perhaps?
July 21, 2014 at 4:25 pm
Jo is probably the best person to do that, she can bring together a vast amount of evidence from different sources.
July 21, 2014 at 5:25 pm
Solid work Ken.
My impression from looking at what you show is that they may be using a iterative process: rinse and repeat homogenisation.
Hadley use such a technique when calculating the “climatology” for SST. They make adjustments, then take the output as input data and start again. They repeat until the results “converge”, ie stop changing more a desired threshold .
I have not idea what the mathematical justification for this is beyond use of the word “converge”. I see no indication in the papers that they have either.
The fact that many of the sites you have highlighted show Acorn trends larger than the mean of their neighbours may suggest this is what they are doing.
By definition all the neighbours of, say, Rabbit Flat have that site as one of their own neighbours. So if RF gets +2 deg C in the first round of ‘corrections’, all its neighbours neighbour groups will have a higher mean after a first application of the algo.
So if they repeat the process for a neighbouring site, that site’s neighbour group will now be warmer that it was the first time around. This will lead to all the neighbours of RF being warmed because RF got warmed.
Rinse and repeat. RF now has warmer neighbours ….
These adjustments will be progressively smaller at each step and at some stage will be small enough to be deemed to have “converged” to a stable result.
That will lead to mean neighbours Acorn being a bit warmer that mean neighbours raw and may explain Rabbit Flat Acorn having higher trend that neighbours raw.
BOM really need to stop screwing around and release a detailed account of their methods, so that they can be validated.
July 21, 2014 at 5:28 pm
Hi Greg
Well spotted. I have long suspected that this is the case.
July 21, 2014 at 5:40 pm
How it would actually affect results and whether is can be justified mathematically depends on how they have implemented it. There is no substitute for them revealing their methods. It is inexcusable that they are make such massive “corrections” without opening up their methods and algorithms for third party inspection and validation.
You could try to find whether there is a station that gets adjusted downwards and see if the opposite happens to the neighbour group.
There’s a limit to how much it’s worth spending time guessing the methods they have so little confidence in they are not prepared to make public, however it you can find such a site it would be interesting to see whether neighbours also get cooled or not.
July 21, 2014 at 7:05 pm
Good idea.
July 21, 2014 at 11:39 pm
Cool posts. As another poster has noted “Steven Goddard” is revealing the same process at USHCN and GISS in the USA.
July 22, 2014 at 7:37 am
I just want to say thank you for all your hard work. Please keep turning over all the stones as long as you’re able!!!
July 26, 2014 at 7:35 am
Greg
‘You could try to find whether there is a station that gets adjusted downwards and see if the opposite happens to the neighbour group.’
I did this with Bourke and neighbouring stations but only for Jan, 1939 (a significant heat wave that month).
Bourke had the highest max raw mean for that period compared to Cobar, Walgett and Tibooburra. After ACORN adjustments, Bourke had the lowest mean.
It’s as if someone compared Bourke’s raw mean to the others and adjusted down but someone else adjusted the neighbouring stations up because of Bourke’s higher raw temps.
July 26, 2014 at 9:26 am
Thanks Ian. I could see how that could happen: replace each stn with the average of its neighbours ( ie not including its own value ).
I don’t know whether they’re doing this across the board as some king of smoothing function or whether it is triggered when there is greater than average variance in the group.
Like I said, I don’t think it’s worth too much effort trying to back-engineer their defective processing. They just need to be pressured to stop buggering about and publish their method or be forced to succumb to an external audit.
They have more than enough huge and obviously spurious adjustments going on here, Clearly some open, third party verification is required.
July 26, 2014 at 6:54 pm
I’m looking at Tarcoola in SA and may post in a few days. Yeah, is it worth the effort?
July 26, 2014 at 8:54 pm
I think it’s well worth what you’ve done so far , pointing out some of the absurdities that the algo is producing.
Working out how and why , probably less so.
They need to publish their methods so that others can reproduce their work. It’s the very basis of the scientific method.
That should have been done from day one.
Making secret “corrections” to data is totally unacceptable in science.
If you are a commonwealth citizen it may be better to spend time badgering them to document and publish their methods.
July 27, 2014 at 6:41 am
Ah- so long since Australia was called a Commonwealth. Something we should all remember.
July 27, 2014 at 9:23 am
Great work!
July 28, 2014 at 3:49 pm
[…] a previous post I looked at the warming outliers in the Acorn network- those sites that had homogenisation adjustments that created a difference of more than +2 degrees […]
August 23, 2014 at 2:50 pm
[…] for further examples and […]
August 27, 2014 at 9:37 am
Good morning Greg
This refers to CAWCR 050 at the Acorn site. Acorn is compared with other datasets including Torok and Nichols(!), but there is NO direct comparison with raw data at the same locations as Acorn.
August 27, 2014 at 12:42 am
Congratulations Ken, this story seems to be getting legs.
some of the quoted matierial over a Jo Nova’s shows BOM claiming this method has been “peer reviewed”.
“‘BOM has rejected Dr Marohasy’s claims and said the agency had used world’s best practice and a peer reviewed process to modify the physical temperature records that had been recorded at weather stations across the country.”
Peer reviewed? That’s news to me, I thought they were steadfastly refusing to make public what thier method actually was.
Do you have anything concrete on that.
If this cliam is factually inaccurate, it needs to be challenged publically.
Now “the heat is on” it would be a good time.
August 27, 2014 at 9:38 am
Sorry, replied in the wrong place. See above.
February 9, 2015 at 5:04 pm
[…] further information and full explanation see https://kenskingdom.wordpress.com/2014/07/16/the-australian-temperature-record-revisited-part-4-outl… […]
December 22, 2015 at 1:38 pm
Thank you for this work. Maybe one day in the future all this will come out officially. Unfortunately our PM and minister Hunt have stopped the enquiry into BOM data so stand by for an ETS next year.
You are a hero. Best wishes. Robin