I’ve been looking at DTR and rainfall relationships for Northern and Southern Australia. I’ve also analysed them by winter and summer (southern and northern wet seasons).
I’ve used a different approach. Instead of comparing DTR with rainfall anomalies (differences from the mean) I’ve converted these to percentage differences from the mean rainfall.
Data are from the BOM climate change page, so DTR is based on Acorn. DTR before 1950, and especially before 1932, may be suspect. However the data are useful for this comparison.
Propositions to test:
DTR which is supposed to decrease as a fingerprint of greenhouse warming, is strongly related to rainfall variation.
There is an unexplained increase in DTR around 2001.
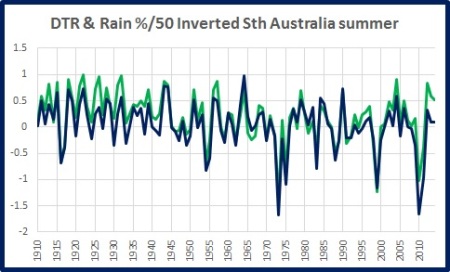
In the time series plots below, rainfall has been inverted, so ‘up’ is dry and ‘down’ is wet. The rainfall anomalies are expressed as percentages difference from the mean and scaled down by 50.


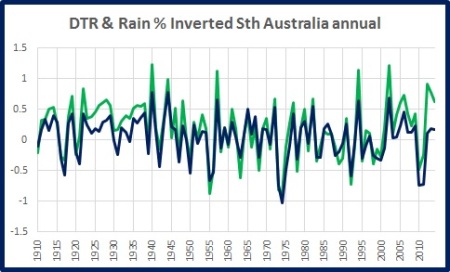

Now comparisons during northern wet season (November to April, basically summer), and southern wet season (May to October- winter and spring).


Results:

Notice that Southern Australian winters dominate DTR. The impact of rainfall on DTR in Southern Australian winters is twice that in Northern Australian winters, and correlates better as well. Also note that Southern summers have very slightly higher DTR change per rainfall change and slightly better correlation than Northern. No doubt you realise winters up here can’t really be compared with southern winters, being mild and very dry. In many places it is not very difficult to double the mean rainfall in winter with not many millimetres of rain, and zero rain for many months in winter is not unusual.
This plot shows Cusums of DTR and inverted, scaled rainfall.

The turning points line up exactly, including 2001. There is no visible unusual change in 2001. There are however times when the Cusums diverge: 1932, 1958, 1985, and 2003 and 2011.
DTR is strongly related to rainfall variation, especially in southern Australia in winter.
There is no unexplained increase in DTR in 2001.

September 13, 2016 at 11:31 am
Hi Ken,
I really appreciate all your hard work. Having read the above post, would you mind adding some explanation about the implications of your findings? If you could explain those in layman’s terms, would be good. I get that there’s a correlation between DTR and rainfall, but what are the implications (how is that relevant) for global warming scaremongers, or the rest of us brow-beaten citizens?
Regards, Brad
September 13, 2016 at 12:00 pm
Gday Brad
This post was just a way of sharing my findings with some people I know who have been asking about DTR.in different regions. Sometimes I just like to look at data out of curiosity.
For a detailed look at DTR as a fingerprint of global warming and its relation to CO2 see my earlier post at
In short, it’s a complete dud.
Ken
September 13, 2016 at 8:25 pm
Hi Ken,
Thanks for the DTR/rainfall info. How do you handle days with zero rainfall if you get down to a daily basis? One could do rank correlations, but in a dry season that lump of low rain readings creates a problem. Is there a classical approach that I can’t recall seeing?
Your manners of presentation here have some internalisation of systematic errors, which is good.
Keep well Geoff.
September 14, 2016 at 6:02 am
Geoff and Ken how about plotting DTR vs Cloud cover and rainfall in a long record dry place where observational data can be used at one site for all.
“Results show that summer mean daily maximum temperature variance is largely explained by changes in cloud cover and precipitation. Cloud cover effect dominates at the high and middle latitudes of NA, and precipitation is a more dominant factor in the southern United States. The results indicate that cloud cover is either the major indicator of the summer mean daily maximum temperature changes (the effect) or the important local factor influencing the changes (the cause). Cloud cover is negatively correlated with mean daily maximum temperature variation in spring and autumn at the middle latitudes of NA but not at the high latitudes.
http://journals.ametsoc.org/doi/abs/10.1175/JCLI-D-12-00225.1
September 14, 2016 at 6:58 am
Worth a try. Very busy this week, remind me if I forget.
Ken
September 14, 2016 at 9:29 am
Sliggy,
I had always assumed that cloud and rain were moderators that I grew up with in the tropics. So the Chinese paper is not new, qualitatively.
Quantitatively, there are not many locations that have good cloud data. Even when they do, clouds are dicey because depending on solids type (ice properties or fog) and altitude, they can be either net absorbers or net emitters of energy.
The big complication as Willis noted years ago is that clouds could well operate on a time scale of minutes to hours. The time of (low) cloud onset in the Tropics lets more or less incoming energy to the ground and the quantities in W per sq m per second are large.
The idea to look at all 3 is good, but if it was easy maybe it would have been done many times before. Geoff.
September 14, 2016 at 6:50 am
Hi Geoff
I looked at Rocky daily and quickly switched too monthly- too noisy. Centred 31 day means and 5 day means might help. I don’t know of any better ways.
September 14, 2016 at 5:47 am
Thanks Ken. Your charts here really help to see what is going on. Now you have me wondering what else correlates with rainfall. Also wondering why you would use ACORN for anything at all.
September 14, 2016 at 6:03 am
“Solar variations affect the abundance of clouds in our atmosphere, a new study lead by DTU Space suggests. Large eruptions on the surface of the Sun can temporarily shield Earth from so-called cosmic rays which now appear to affect cloud formation.”
http://www.space.dtu.dk/english/news/2016/08/solar_variations_svensmark_2016?id=b759b038-66d3-4328-bbdc-0b0a82371446
September 14, 2016 at 6:22 am
“Our latest measurements show that cosmic rays are intensifying, with an increase of almost 13% since 2015:”
http://www.spaceweather.com/
See also http://cr0.izmiran.rssi.ru/mosc/main.htm
September 14, 2016 at 6:55 am
I could try with cloud but cloud observations are very subjective, and altitude, thickness, type, are not icluded in coverage
Acorn because that’s the best readily available for DTR. I have some AWAP data for Australia as a whole.
September 14, 2016 at 6:55 am
Humidity might be interesting.
September 19, 2016 at 7:32 pm
[…] A Reality Check on Global Warming « DTR and Rainfall […]