In my last brief post I showed how Diurnal Temperature Range is related to rainfall in Northern and Southern Australia in Northern and Southern wet seasons (which correspond roughly to summer and winter).
In this post I show the relationship between DTR and daytime cloud, and between rainfall and daytime cloud, and something very peculiar about South-Western Australia.
All data are taken straight from the Bureau’s Climate Change Time Series page.
DTR is affected by rainfall through Tmax being cooled by cloud albedo, evaporation and transpiration, and Tmin warmed by night cloud and humidity. There must be a relationship between clouds and rain, although it is (rarely) possible to have rain falling from a clear sky with no visible cloud. Rain is easily measured in standard rain gauges. Cloud is calculated by trained observers, and we only have data for 9 a.m., 3 p.m., and daytime cloud. The data give no indication of cloud type, thickness, or altitude, just amount of sky covered (in oktas, or eighths).
Here I show scatterplots for Australia as a whole annually, and for Northern, South-Eastern, and South-Western Australia in summer and winter. I calculate both rainfall and cloud as percentage differences from their means.
Fig. 1: DTR vs Rain for Australia annually:

Fig. 2: DTR vs Cloud for Australia annually:

Notice much better correlation between DTR and Cloud.
Now let’s look at the relationship between rainfall and daytime cloud.
Fig. 3: Percentage difference in Rainfall vs percentage difference in Cloud for Australia annually:

Note a 10% increase in cloud cover could be expected to be associated with a 25% increase in rainfall.
Fig. 4: Percentage difference in Rainfall vs percentage difference in Cloud North Australian summers:
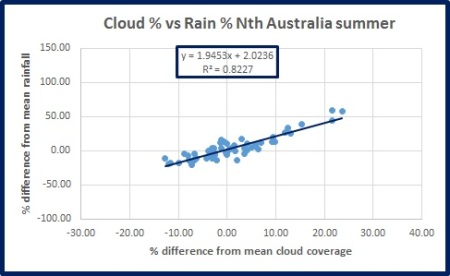
Fig. 5: Percentage difference in Rainfall vs percentage difference in Cloud North Australian winters:

Note how rainfall in the North Australian dry season varies proportionally more, but has a slightly lower correlation (>0.8 vs 0.9).
Fig. 6: Percentage difference in Rainfall vs percentage difference in Cloud South-East Australian summers:
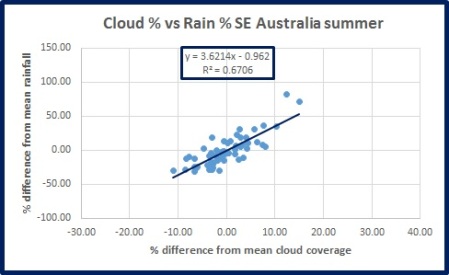
Note the much greater effect of cloud on rainfall in the southern dry season.
Fig. 7: Percentage difference in Rainfall vs percentage difference in Cloud South-East Australian winters:

Now, get ready for a surprise.
Fig. 8: Percentage difference in Rainfall vs percentage difference in Cloud South-West Australian summers:

Fig. 9: Percentage difference in Rainfall vs percentage difference in Cloud South-West Australian winters:

What’s going on in the south-west?
Here’s how DTR compares:
Fig. 10: DTR vs percentage difference in rainfall: South-west Australia

Similar relationship to everywhere else.
Fig. 11: DTR vs percentage difference in cloud cover: South-west Australia

And this graph clearly shows the relationship between rain and cloud is closer in the wet seasons, but also clearly shows that South-west Australia is an extreme outlier.
Fig. 12: R-squared comparison between rain and cloud in wet and dry seasons

Why the huge difference? There is no relationship between cloud and rain in south-west Australia, unlike everywhere else. The South-West has seen a marked decline in rainfall since the late 1960s, but an increase in cloud cover. It seems counter intuitive, but there you go.
Any suggestions are welcome.

September 20, 2016 at 10:57 pm
Ken,
Yet again, very thought provoking stuff.
I suspect the issue with the South West many have something (I am not sure exactly what) to do with the use of DTR anomalies (i.e. DTR -average DTR for that month) compared to just using DTR calculated directly from Tmax – Tmin.
I have downloaded the monthly cloud data and Acorn Tmax and Tmin data and rain data for Perth Airport from 1955 until 2015.
Firstly for the rain data, if you correlate this with the DTR anomalies, the value for R2 is only 0.114. However if you correlate rain directly with DTR the R2 improves greatly to 0.706.
For the cloud data correlated with DTR anomalies the value of R2 =0.227. For the cloud data and DTR, the correlation improves to R2= 0.731.
Rain versus cloud gives R2 =0.547.
It seems, if we had the actual DTR values rather the anomalies for S.W Australia, we might get a much better correlation than was found above.
Ken, I know you have a large collection of temperature data both raw and homogenized for all the Acorn sites. Maybe you could look at some other sites in the south west, that have cloud data, to see if this pattern is common to these sites.
Like you I am puzzled why S.W Australia exhibits this outlier behaviour when compared to the rest of Australia.
I have links to plots of the data here – http://s20.postimg.org/9xmp8c44d/DTR_Cloud_and_Rain4.jpg and http://s20.postimg.org/pt6xxw5b1/Rain_versus_Cloud.jpg .
Ken, I hope this provides food for thought for you, or someone else reading this blog. All very interesting.
September 21, 2016 at 8:36 am
Hi Mike
Just where did you get hold of cloud data for individual sites? That would be very handy.
September 21, 2016 at 10:54 am
Hi Ken,
I got hold of the cloud data from the BOM ‘site networks’ under climate change, see- http://www.bom.gov.au/climate/change/index.shtml#tabs=Tracker&tracker=site-networks .
You will find the sites that have cloud data in Australia or a particular region by selecting the Daytime Cloud (or 9 am, 3pm) option.
It would be interesting to see if DTR derived from the Raw data gives better or worse correlations than DTR derived from the homogenized Acorn data. I might have a go at that for the Perth data if I can find the time.
September 21, 2016 at 1:08 pm
Ah ha! Thank you Mike!
September 21, 2016 at 3:10 pm
Ken, That’s OK. The B.O.M. did not make it easy to find and you have to go elsewhere on their site to download the appropriate rainfall data.
September 29, 2016 at 9:05 am
Ken here is a UK site that has the temp data-bases in one handy package. All EXCEPT UAH V 6 of course and yet they’ve already included RSS V 4 as well.
You’ll see the name Cowton , so I’d suggest this is an alarmist uni site. But RSS V 3 shows 0.068 c/decade rise since 1998.5 and this builds to 0.1 c decade for RSS V 4.
What do you think?
http://www.ysbl.york.ac.uk/~cowtan/applets/trend/trend.html
September 29, 2016 at 5:38 pm
Yep, alarmist. Good to have them all in one place though.
September 29, 2016 at 9:42 pm
Interesting using their calculator for global HAD 4 shows a temp trend of just 0.5 c per century since 1850. And global GISS shows a temp trend of just 0.7 c per century since 1880.
That slight warming is calculated after the end of the LIA. So what’s the fuss about?
September 29, 2016 at 9:51 pm
Hi ngard,
An even better site for data, including UAH v6 beta for both TLT and TMT is Nick Stokes site see – https://moyhu.blogspot.com.au/p/latest-ice-and-temperature-data.html#L1 .
If you are worried about being adversely affected by the contents of the site, then put your blinkers on.
September 30, 2016 at 9:07 am
MikeR I find the software very difficult to use at Nick’s site. But Werner Brozek uses Nick’s site and stats to do his monthly( ?) update of the data-sets at WUWT.
His last update found no stat significant warming for UAH V 6 for 23 years 1 month and RSS for 22 years 8 months. I’m a computer dummy with zero skills and understanding and I find all software to be a challenge to put it mildly.
But please tell us the UAH V 6 trend per century since 1998.5 using Nick’s calculator.
Here is an interesting testimony from Dr John Christy before the US house committee earlier this year. He compares the trends to model forecasts etc and he also highlights the close agreement between satellites and balloon data, BTW can you please tell me what Nick’s calculations find for HAD 4 and GISS since 1850 and 1880. There can’t be much difference than the Cowton site I quoted above.
Click to access HHRG-114-SY00-Wstate-ChristyJ-20160202.pdf
September 30, 2016 at 9:09 am
Sorry Ken but I’ve landed in moderation.
October 1, 2016 at 7:33 pm
Ken you do a lot of amazing work. Have found something interesting here. May be adding 2 and 2 to get 5 though.
“We have now also now found that lightning activity around the globe is closely linked to the amount of water vapor in the upper atmosphere. The thunderstorms that produce the lightning also transport large amounts of water vapor into the upper atmosphere.”
http://www.tau.ac.il/~colin/research/Atmos-Elec/atmos.html
and
“Evidence for solar wind modulation of lightning”
“Arrival of the high speed stream at Earth also coincides with a small (~1%) but rapid decrease in galactic cosmic ray flux, a moderate (~6%) increase in lower energy solar energetic protons (SEPs), and a substantial, statistically significant increase in lightning rates.”
http://iopscience.iop.org/article/10.1088/1748-9326/9/5/055004
October 1, 2016 at 8:00 pm
These are interesting too.
“Earth generates its own solar wind”
http://www.abc.net.au/science/articles/2013/07/03/3794480.htm
and
“A link between high-speed solar wind streams and extratropical cyclones”
“This evidence shows that explosive extratropical cyclones tend to occur after arrivals of solar wind disturbances such as high-speed solar wind streams from coronal holes when large amplitude magneto-hydrodynamic waves couple to the magnetosphere-ionosphere system. ”
https://indico.cern.ch/event/472838/contributions/1150257/
October 1, 2016 at 10:39 pm
Ngard,
I agree with you that Nick Stokes site can be a challenge when you first try to use his graphs but you get used to it after a short while.
The figure for UAH v6 beta TLT since 1998.5 is 0.071 degrees per decade with a lower limit of -0.044 and upper limit of 0.186 degrees per decade (95% confidence). As the lower limit is less than zero the value of positive 0.071 is not statistically significant.
All values shorter than 23 years (i.e. starting after 1993) are not statistically significant for the UAH data at this level of confidence. Only periods longer than that are statistically significant for the UAH satellite data and the trends for these longer periods are all positive.
You can find more comments that I have made at another site agreeing with Werner Brozek’s similar analysis at http://jennifermarohasy.com/2016/08/speaking-truth-to-power/#comment-582148 and in my comment immediately below that.
October 8, 2016 at 1:18 pm
Ken,
A delight to find your site that focuses on observation. One quibble about this sentence:
“Tmin warmed by night cloud and humidity”.
The air is constantly moving. Wind from the north west is warm and wet. When it arrives Tmin rises.It does so because the air comes from a warm wet place and is therefore cloudy. Later, in about ten days a south west wind arrives from a cool dry place and TMin falls.
So DTR varies with the origin of the air. The temperature of the air and its DTR characteristics are those of the location from whence it comes.
Sliggy, thanks for this very useful link:
https://indico.cern.ch/event/472838/contributions/1150257/
Large parts of inland south west WA get rain from tropical sources in both summer and winter and south coast parts from both tropical and west coast influences. Perhaps it might be an idea to correlate inland WA rainfall with north west cloud.
For data I go to http://www.esrl.noaa.gov/psd/cgi-bin/data/timeseries/timeseries1.pl
Suggest you correlate surface temperature with surface pressure like here: https://i0.wp.com/reality348.files.wordpress.com/2016/10/sst-and-slp-s-hem.jpg?ssl=1&w=450
Are you aware that the entire southern hemisphere is no warmer in the month of December than it was in 1948. That single fact should kill the AGW argument.
October 8, 2016 at 5:01 pm
Gday Erl
It depends on the season and location. Naturally humidity blows in with the wind. If it comes from the ocean it will be more humid, from inland less humid. Once it’s here it warms a bit less in daytime and cools less at night. But DTR characteristics in Rockhampton for example are not the same as the Pacific Ocean or western NSW. Temperature depends to a great deal on wind direction, even more on cloudiness.
October 9, 2016 at 8:57 am
Hi Ken, It is often asserted that the reason for the overnight warmth when the sky is cloudy is back radiation. That’s what I am querying. I am asserting that the overnight warmth has to do with the character of the air, the fact that cloud shields the surface from radiation during the day making for a low maximum and the air remains warm overnight because it continues to arrive from a warm wet place, not because of back radiation from cloud.
All East coast locations experience a heightened annual range and my guess is that the daily range fluctuates with the direction of the wind.
Warm air has more radiation going in all directions.
Its also asserted that the surface of the Earth has warmed due to back radiation from increasing greenhouse gas content, But the entire southern hemisphere is no warmer in the month of December in the last decade than it was in 1948-57. So, that theory is incorrect.
October 9, 2016 at 9:37 am
An interesting idea. Humidity has a similar though weaker effect to cloud. With no wind at all for days at a time high humidity (eg following recent rain) is associated with warmer nights.
October 9, 2016 at 9:06 pm
Erl,
Your statement ” the entire southern hemisphere is no warmer in the month of December in the last decade than it was in 1948-57. So, that theory is incorrect” is patently ridiculous.
Where did you get your data regarding December temperatures in the Southern Hemisphere.?
Here is the real data.
http://www.ncdc.noaa.gov/cag/time-series/global/shem/land_ocean/1/12/1948-2015
http://www.bom.gov.au/climate/change/index.shtml#tabs=Tracker&tracker=global-timeseries&tQ=graph%3Dglobal_t%26region%3Dsh%26season%3D12%26ave_yr%3D
http://www.metoffice.gov.uk/hadobs/hadcrut4/data/current/time_series/HadCRUT.4.5.0.0.monthly_sh.txt
http://data.giss.nasa.gov/gistemp/tabledata_v3/SH.Ts.txt
Not even close.
October 10, 2016 at 8:30 am
Miker
Data source: http://www.esrl.noaa.gov/psd/cgi-bin/data/timeseries/timeseries1.pl
In terms of sea surface temperature: https://i2.wp.com/reality348.files.wordpress.com/2016/08/sh-sst.jpg?ssl=1&w=450
‘Air temperature at 1000 hPa:
https://i2.wp.com/reality348.files.wordpress.com/2016/09/1000-hpa-t.jpg?ssl=1&w=450
Sea surface temperature December and June: https://i2.wp.com/reality348.files.wordpress.com/2016/09/sst-jan-and-june.jpg?ssl=1&w=450
No, definitely no greenhouse effect.
And I am pleased to hear that the trend is the same in all the other data sets…..but I will take that with a grain of salt.There is not a lot of data to be had for the southern hemisphere so reanalysis is the best we have.
October 9, 2016 at 10:05 pm
ERL, I do notice that the ESRL NCEP Reanalysis data shows a decrease for the S. H. from 1948 until the present as long as you include latitudes south of – 70 degrees.
If you only use latitudes from 0 to – 70 which is around 94% of the surface of the S.H., the trend is in agreement with all the other datasets. It is amazing how the lack of water vapor in Antarctica can skew the results.
October 18, 2016 at 1:44 pm
Ken there is a big change in some regions for UAH V 6 data in September. And OZ temp has dropped a lot. Your update for Sept should look interesting.