By Ken Stewart, ably assisted by Chris Gillham, Phillip Goode, Ian Hill, Lance Pidgeon, Bill Johnston, Geoff Sherrington, Bob Fernley-Jones, and Anthony Cox.
The Bureau of Meteorology maintains the Southern Oscillation Index (SOI), one of the most useful climate and weather records in the world. In About SOI, the Bureau says:
Daily or weekly values of the SOI do not convey much in the way of useful information about the current state of the climate, and accordingly the Bureau of Meteorology does not issue them. Daily values in particular can fluctuate markedly because of daily weather patterns, and should not be used for climate purposes.
It is a pity that the BOM doesn’t follow this approach with temperature, and in fact goes to the opposite extreme.
Record temperatures, maximum and minimum temperatures, and monthly, seasonal, and annual analyses are based not on daily values but on ONE SECOND VALUES.
The Bureau reports daily maximum and minimum temperatures at Climate Data Online, but also gives a daily summary for each site in more detail on the State summary observations page , and a continuous 72 hour record of 30 minute observations (examples below), issued every 30 minutes, with the page automatically refreshed every 10 minutes, also handily graphed . These last two pages have the previous 72 hours of readings, after which they disappear for good. However, the State summary page, also refreshed every 10 minutes, is for the current calendar day only.
This screenshot shows part of the Queensland observations page for February 26, showing the stations in the North Tropical Coast and Tablelands district.
Fig. 1: District summary page

Note especially the High Temp of 30.5C at 01:26pm. Clicking on the station name at the left takes us to the Latest Weather Observations for Mareeba page:
Fig. 2: Latest Observations for Mareeba

Notice that temperature recordings are shown every 30 minutes, on the hour and half hour.
In Figure 1 I have circled the Low Temp and High Temp for Mareeba. Except in unusual circumstances, High Temp and Low Temp values become the maximum and minimum temperatures and are listed on the Climate Data Online page, and for stations that are part of the ACORN network, become part of the official climate record. It is most important that these High Temp and Low Temp values, the highest and lowest recorded temperatures of each day, should be accurate and trustworthy.
But frequently they are higher or lower than the half hourly observations, as in the Mareeba example (0.6C higher), and I wanted to know why. In this post I show some recent examples, with the explanation from the Bureau.
Perhaps the difference between the Latest Weather Observations and maximum temperature reported at Climate Data Online is due to brief spikes in temperature in between the reported temperatures of the latest observations, such as in this example from Amberley RAAF on February 12.
Fig. 3: Amberley RAAF temperatures, 12 February 2017

A probable cause would be that the Automatic Weather Station probe is extremely sensitive to sudden changes in temperature as breezes blow warmer or cooler air around or a cloud passes over the sun.
However, this may not be the whole story.
Occasionally the report time for the High Temp or Low Temp is exactly on the hour or half hour, and therefore can be directly compared with the temperature shown for that time at the station’s page.
These progressive Low and/or High Temps on the half hour or hour occur and can be observed throughout the day at various times, as well as at the end of the reporting period.
For example, here is a mid-afternoon screenshot of the Queensland- Wide Bay and Burnett district summary for Wednesday 15th February. I have highlighted the High Temp value for Maryborough at 1:00pm.
Fig. 4: District summary at 2:00pm for Maryborough 15 February 2017

In the Latest Observations for Maryborough, I have highlighted the 1:00pm reading.
Fig. 5: Latest Observations at Maryborough at 01:00pm on 15 February

The difference is +1.5 degrees. Here I have graphed the results.
Fig. 6: Maryborough 15 February
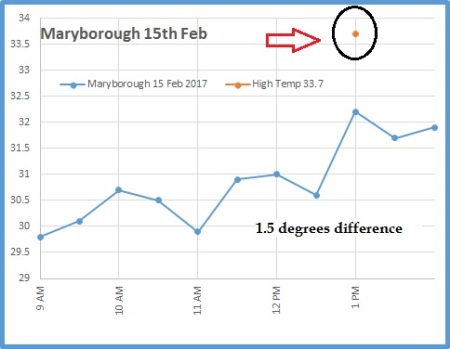
That’s a 1.5 degree difference at the exact same minute.
Here is a screenshot of Latest Observations values at Hervey Bay Airport on Wednesday 22 February. Low Temp for the morning of 23.2C was reached at 6.00 a.m.
Fig. 7: Hervey Bay, 06:00am 22 February 2017

Note that at 6.00am, just after sunrise, the Latest Observations page shows that the temperature was 25.3 degrees. The daily Low Temp was reported as 23.2 degrees at 6.00am – 2.1 degrees cooler. This graph will show the discrepancy more plainly.
Fig. 8: Hervey Bay temperatures 22 February

What possible influence would cause a dawn temperature to drop 2.1 degrees?
I sent a query to the Bureau about Hervey Bay, and the explanation from the Bureau’s officer was enlightening:
Firstly, we receive AWS data every minute. There are 3 temperature values:
1. Most recent one second measurement
2. Highest one second measurement (for the previous 60 secs)
3. Lowest one second measurement (for the previous 60 secs)
Relating this to the 30 minute observations page: For an observation taken at 0600, the values are for the one minute 0559-0600.
I’ve looked at the data for Hervey Bay at 0600 on the 22nd February.
25.3, 25.4, 23.2 .
The temperature reported each half hour on the station Latest Observations page is the instantaneous temperature at that exact second, in this case 06:00:00, and the High Temp or Low Temp for the day is the highest or lowest one second temperature out of every minute for the whole day so far. There is no filtering or averaging.
The explanation for the large discrepancy was that “Sometimes the initial heating from the sun causes cooler air closer to the ground to mix up to the temperature probe (1.2m above ground).”
However, in Figure 7 above it can be seen that the wind was south east at 17 km/hr, gusting to 26 km/hr, and had been like that all night, over flat ground at the airport, so an unmixed cooler surface layer mixing up to the probe seems very unlikely.
You will also note that the temperatures in the final second of every half hour period from 12.30 to 6.30 ranged from 25C to 25.5C, yet in some second in the final minute before 6.00 a.m. it was at 23.2C. I have shown these values in the graph below.
Fig. 9: Hervey Bay 05:59 to 06:00am

The orange row shows the highest temperature for this last minute at 25.4C at some unknown second, the blue row the lowest temperature for this minute (and for the morning) at 23.2C at some unknown second, and the spot temperature of 25.3C at exactly 06:00:00am. The black lines show the upper and lower values of half hourly readings between 12:30 and 06:30: the high temp and 06:00am readings are within this range.
23.2C looks a lot like instrument error, and not subject to any filtering.
Further, there are only two possibilities: either from a low of 23.2C, the temperature rose 2.2 degrees to 25.4C, then down to 25.3C; or else from a high of 25.4C it fell 2.2 degrees to 23.2C, then rose 2.1 degrees to 25.3C, all in the 60 seconds or less prior to 06:00:00 a.m.
How often does random instrument error affect the High and Low Temps reported at the other 526 stations? Like Thargomindah, where on February 12 the High Temp was 2.3 degrees to 2.5 degrees higher than the temperatures 15 minutes before and after?
Fig. 10: Thargomindah temperatures 12 February 2017

Or was this due to a sudden rise and fall caused by a puff of wind, even a whirl-wind?
Who knows? The Bureau certainly doesn’t.
In Part 2, I will look at patterns arising from analysis of 200 High and Low Temps occurring in the same minute as the half hourly values, and implications this has for our climate record.
Tags: bom, extremes, temperature, weather

March 1, 2017 at 10:39 pm
Ken has identified apparent errors greater than 2 degrees celsius for Tmax and Tmin reported by Automatic Weather Stations. Any trend calculations using data from before the era of AWS will need to take this into account. The error bands now become wider, the apparent trends more uncertain.
March 2, 2017 at 12:19 am
or a ‘new’ homogenisation method will make the higher/lower temps more certain.
IF the BOM provide further explanation expect ‘world’s best practice’ to be quoted loudly and often.
March 2, 2017 at 8:38 am
John that could be quite a condemnation of “Worlds best practice” if the outlier turns out to be caused by a fault in the electronics or software that perverts the maximum or minimum value.
March 2, 2017 at 5:15 pm
With the several examples Ken has identified it would not appear to be a fault unless all of the devices have an inherent design fault.
Also, ‘World’s best practice’ does not necessarily mean it is correct and we know from the balls up they have made of temperature records that the term condemns itself.
March 3, 2017 at 2:30 am
Ken, you and your readers may be interested in a recent post about why ACORN-SAT gets it wrong, it may be mostly the assumption that non-climatic influences do not vary with time. It was seeing a photo of the Stevenson screen in a built-up space at Deniliquin that made me realise how bad that assumption is:
Your paper with David Stockwell was spot-on.
March 3, 2017 at 10:29 am
The use of AWSs for weather and climate purposes raises several major problems.
1. They have different thermal characteristics to any Stevenson screen variety.
2. They are mostly located near airports, where unrepresentative hot air from hard surfaces or aircraft may affect the output, as well as cold air from hard surfaces particularly on winter nights.
3. Using a high or low short term data point should not be used as would unlikely be measured in a Stevenson screen.
On a hot day with no wind, the temperature measured in a Stevenson screen is not necessarily the same as the air temperature outside 1.4 m above the ground.
For the aircraft industry, the near instantaneous temperature and wind data are most valuable, but difficult to justify for use as long term climate data.
If the BoM uses AWS data for its ACORN/climate data, then it should use its pre-1910 data, even if there is a possibility of small errors. The BoM has refused to acknowledge the Australian heatwaves of the late nineteenth century.
March 4, 2017 at 1:57 am
Thank you for enlightening us so.
Working outdoors all my life, I, unlike others in my family, prefer hot (inland, dry) weather to cold. This suggests to me that my body has a more cooling oriented system than they do.
On windy days with temps of 100 plus, (40 less common), you often get hit by a gust which seems much hotter on the bare skin. I have always wondered, is that air really so much hotter? It’s hard to believe with so much turbulence that it could be. Perhaps the extra velocity overloads the cooling capacity of the skin? I wished I had a way to check it out.
That said, how many ways were temps historically recorded? How many daily with a max / min thermometer? How many at shorter intervals over 24 hours? How many irregularly? And how many types of thermometer were used? I am not aware of old technologies which could deliver on a single second basis. Even a single minute I’d have thought to be pushing it. Therefore these “outliers”, while worthy of record, surely do not represent a fair comparison with the historical record.
March 4, 2017 at 7:02 am
Your comments are exactly right. Part 2 will look at these questions.
March 4, 2017 at 6:57 pm
Thanks for this enlightenment, Ken. I have been watching closely, the same temperature spikes here in Broome, and some of these coincided with jet aircraft movements when wind was blowing across the runway from the passenger parking apron.
Four helicopter hangars were recently built within a hundred metres of the BoM radar tower and instrument field. This could also have an influence on brief spikes, but no schedules for their activities were available. There were 15 large helicopters based there until Woodside pulled out from the Browse field.
https://pindanpost.com/2016/03/26/jet-fueled-temperature-rises-for-broome/
March 4, 2017 at 6:58 pm
More here: https://pindanpost.com/2016/04/30/broome-weather-extremes-april/
March 8, 2017 at 2:19 pm
Interesting that we’ve been bombarded today from Steffen’s Climate Council about our hot angry summer. It seems Steffen etc can see a trend brought on by their CAGW.
But if that’s the case why isn’t the WA trend the same as eastern OZ? The WA anomaly for T max is cooler for last summer and the T max anomaly for Eastern OZ is warmer and the 2 halves have the same 400+ ppm co2 driver???
Magical stuff this co2, it can cause a hot angry summer in the east and a cooler summer in the west. Amazing and of course Nat weather variability wouldn’t have anything to do with it? Same goes for rainfall as well. Just incredible isn’t it? Any thoughts?
http://www.bom.gov.au/jsp/awap/temp/index.jsp?colour=colour&time=latest&step=0&map=maxanom&period=3month&area=nat
March 8, 2017 at 7:06 pm
+10
March 13, 2017 at 10:04 pm
Thanks Ken. This is an important article and highlights a potentially serious problem. It a measurement system is in anyway “noisy” taking instantaneous readings seriously is an unreliable practice. In this day of cheap computing why can’t they be averaged using multiple samples over a couple of minutes – with the larger outliers (glitches) thrown out?
March 16, 2017 at 4:23 pm
Hi Ken, Siliggy is here with me. He says look at BOM site info PDF , notice how the minimum thermometer has been replace frequently in very recent years.
Also both electronic and in glass thermometers in use
http://www.ozbc.net/weather_aws.htm
March 21, 2017 at 10:33 am
[…] the previous post of this series I explained how the Bureau of Meteorology presents summaries of weather observations […]
April 2, 2017 at 8:33 am
website
How Temperature Is “Measured” in Australia: Part 1 | kenskingdom
August 7, 2017 at 4:56 pm
[…] here and […]
September 13, 2017 at 6:55 pm
“The explanation for the large discrepancy was that “Sometimes the initial heating from the sun causes cooler air closer to the ground to mix up to the temperature probe (1.2m above ground).”
However, in Figure 7 above it can be seen that the wind was south east at 17 km/hr, gusting to 26 km/hr, and had been like that all night, over flat ground at the airport, so an unmixed cooler surface layer mixing up to the probe seems very unlikely.
You will also note that the temperatures in the final second of every half hour period from 12.30 to 6.30 ranged from 25C to 25.5C, yet in some second in the final minute before 6.00 a.m. it was at 23.2C. I have shown these values in the graph below.”
Yes, their explanation is correct … I’ve seen that happen (retired meteorologist) while on duty.
The wind is measured at 10m and the thermo is at 1.2 m. And can easily be unable to mix surface clinging colder/denser air at in the presence of a low level inversion, despite being 10KT gusting 15. There would have been an inversion below anemom height. At Dawn as the sun hits the ground mix the cold air at ground level upwards in the process of breaking break the inversion. The air would likely have been very dry and over grass below the screen.
September 13, 2017 at 8:32 pm
OK, noted. Watch for an upcoming post on Hervey Bay. Your comments would be welcome.
September 14, 2017 at 7:39 pm
[…] in a comment at How Temperature Is Measured In Australia Part 1, Tony Banton, a retired meteorologist, says that the BOM explanation of cooler ground level air […]
October 19, 2017 at 7:01 pm
[…] examples from Ken Stewart here […]
October 20, 2017 at 5:26 am
[…] More examples from Ken Stewart here and here […]
October 20, 2017 at 6:19 am
[…] More examples from Ken Stewart here and here […]
March 7, 2019 at 10:41 am
[…] https://kenskingdom.wordpress.com/2017/03/01/how-temperature-is-measured-in-australia-part-1/#commen… […]