The complete UAH v6.0 data for March have been released. I present all the graphs for various regions, and as well summaries for easier comparison. I also include graphs for the North and South Temperate regions (20-60 North and South), estimated from Polar and Extra-Tropical data.
The Pause has ended globally and for all regions including the USA and the Southern Hemisphere, except for Southern Extra-Tropics, South Temperate, South Polar, and Australia. The 12 month mean to March 2017 for the Globe is +0.40 C- down 0.12 C in four months.
These graphs show the furthest back one can go to show a zero or negative trend (less than 0.1 +/-0.1C per 100 years) in lower tropospheric temperatures. I calculate 12 month running means to remove the small possibility of seasonal autocorrelation in the monthly anomalies. Note: The satellite record commences in December 1978- now 38 years and four months long- 460 months. 12 month running means commence in November 1979. The y-axes in the graphs below are at December 1978, so the vertical gridlines denote Decembers. The final plotted points are March 2017.
[CLICK ON IMAGES TO ENLARGE]
Globe:

The Pause has ended. A trend of +0.41 C/100 years (+/- 0.1C) since February 1998 is creeping up, but the 12 month means have peaked and are heading down.
And, for the special benefit of those who think that I am deliberately fudging data by using 12 month running means, here is the plot of monthly anomalies:

Northern Hemisphere:

The Northern Hemisphere Pause has well and truly ended.
Southern Hemisphere:

The Pause has ended but temperatures for the last 19 years are rising very slowly.
Tropics:

The Pause in the Tropics (20N to 20S) has ended and the minimal trend is now +0.43C/ 100 years. 12 month means are dropping fast.
Northern Extra Tropics:

Northern Temperate Region:

Using estimates calculated from North Polar and Northern Extra-Tropics data, the slowdown is obvious.
Southern Extra Tropics:

The Pause has weakened and shortened but still persists.
Southern Temperate Region:
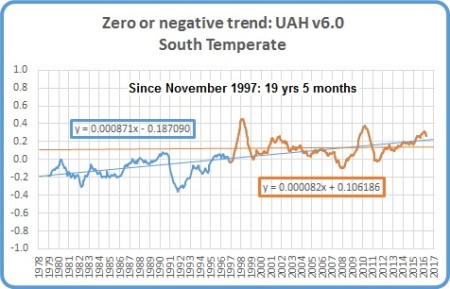
Using estimates calculated from South Polar and Southern Extra-Tropics data, the Pause likewise persists.
Northern Polar:

The trend has increased rapidly and will continue to do so even though 12 month means have started to fall.
Southern Polar:

The South Polar region has been cooling (-0.17C) for the entire record. With 12 month means still rising, this cooling trend will slow over the next few months.
USA 49 States:

The Pause has ended. It will not re-appear for some time.
Australia:
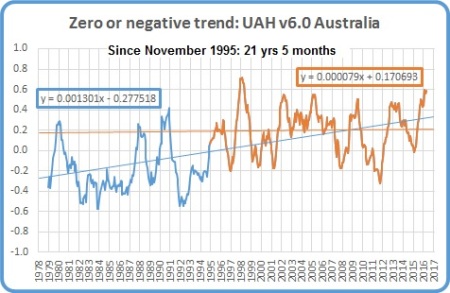
The Pause is still 21 years 5 months- well over half the record.
The next graphs summarise the above plots. First, a graph of the relative length of The Pause in the various regions:

Note that the Pause has ended by my criteria in all regions of Northern Hemisphere, and consequently the Globe, and the Tropics, but all southern regions have a Pause for over half the record, including the South Polar region which has been cooling for the whole record. Note that the Tropic influence has been enough to end the Pause for the Southern Hemisphere.
The variation in the linear trend for the whole record, 1978 to the present:

Note the decrease in trends from North Polar to South Polar.
And the variation in the linear trend since June 1998, which is about halfway between the global low point of December 1997 and the peak in December 1998:

The imbalance between the two hemispheres is obvious. The lower troposphere over Australia has been strongly cooling for 18 years and 10 months- over half the record. The Pause has disappeared from the USA and the Southern Hemisphere, but not the Southern Extra-Tropics, South Temperate, and South Polar regions, or Australia. El Nino tropical heat is rapidly decreasing, with all means except the South Polar region falling. The next few months will be interesting.

April 15, 2017 at 4:14 pm
Interesting indeed. Whatever will the alarmists make of it?
April 15, 2017 at 4:45 pm
While the lines pass trhough the points legitimately and show now a rise, this is surely built specifically on a longer than usual retention of the the effect of the recent very strong El Nino. Nearly all of the current trends from that peak in 2016 are quite obvioulsly and stongly heading south.
Thus, I believe it is too early to call the end to the Pause.
April 15, 2017 at 5:37 pm
And indeed the pause will reappear in a few months’ time.
April 30, 2017 at 10:27 am
Ken the UAH V 6 TLT shows no warming or cooling for the SP region and yet you show slight cooling for SP since DEC 1978. Why is that? Their TMT does show cooling of -0.02 c.
April 30, 2017 at 5:24 pm
Probably because I use 12 month means.
April 30, 2017 at 3:15 pm
“And indeed the pause will reappear in a few months’ time.”
Global since 1998? Odds are very slim.
But at least you made a prediction which you can test by year’s end.
April 30, 2017 at 3:16 pm
April 30, 2017 at 3:17 pm
That article also includes UAH data.
April 30, 2017 at 5:30 pm
“But at least you made a prediction which you can test by year’s end”
No, if you are familiar with past posts I have always said the pause is unlikely to reappear before early 2018. I don’t specify how many months is ‘a few’, but more than a couple and less than many. Check again about this time next year- unless something unexpected happens it won’t be this year.
April 30, 2017 at 9:43 pm
Oh, I took any prediction in months to be at least less than a year.
However, I think the return of the pause is unlikely. What it would take for that to happen (global trend) by 2020 is given a little copy in the WUWT article.
May 1, 2017 at 7:20 am
“Oh, I took any prediction in months to be at least less than a year.”
Well, when I went to school a year had 12 months. 9 months (April-December) is definitely less than a year.
As to a return to a pause, as I said it is unlikely before early 2018. The next few months will give a better indication. The BOM currently has El Nino watch for the next 3 months, and another El Nino is possible, but don’t pin your hopes on it.
May 1, 2017 at 1:33 pm
You’d need temps similar to 1994 and 1995 (UAH)* to get a flat trend again. We didn’t get that even with the double la Nina 1999-2000. I think you’re most likely to be disappointed.
* This is the latest adjusted record, UAH version 6.
April 30, 2017 at 9:46 pm
Even if we had a double la Nina like in 1999/2000 it still wouldn’t go quite flat. We’d have to have the next three years look like UAH 1994-1996 to bring back the pause. Do you think that’s likely?
May 1, 2017 at 3:45 pm
It seems to me that on the right hand side of every graph – the latest temperatures – the plot is heading south which may well continue and finally come back to a horizontal line demonstrating a continued pause.
If one looks at the satellite data from both sources GSS and UAH, the rapid warming from 1979 shown in the ground based measurements was not reflected in those measurements. However, the satellites did respond to the large 1997-1998-1999 El Nino and has cone so again. It therefore seems to me unlikely these records will return to normality about next yearirrespective of the findings from ground based stations. Unfortunately I believe UAH is to be closed down – probably before the temperature falls back to this “normal” level.
Ever the optimist!
Regards,
John
May 2, 2017 at 9:22 am
TLT UAH V 6 increased during April, up from March 0.19 c to 0.27 c.
But surface data are showing big falls according to Dr Ryan Maue. Looks like TLT is still retaining some El Nino leftovers.
May 14, 2017 at 9:47 am
RSS V 3 increased during April to 0.39 c up from 0.35 c in March. UAH V 6 increased by about 0.08c and RSS V 3 increased by about 0.04 c since March.
http://data.remss.com/msu/graphics/TLT/time_series/RSS_TS_channel_TLT_Global_Land_And_Sea_v03_3.txt
May 14, 2017 at 9:59 am
There appears to be a possible 4 to 5 year oscillation in all of these records Ken. A bit of Fourier analysis may show some strong cycles which could be interesting.
John
John Nicol
60/50 Coriander Place, Forest Lake Qld 4078
Ph: (07) 3879 8848
Mob: 0409 761 503
Email: jonicol18@bigpond.com
May 15, 2017 at 7:15 am
There is a quasi-cycle related to ENSO in all regional data. UAH regional data for April still not yet available- very slow this time
May 18, 2017 at 8:57 am
UAH V 6 TLT is now available online.