Here’s a fresh look at global temperatures as calculated by the University of Alabama, Huntsville- the UAH dataset– from satellite measurements of the Temperature of the Lower Troposphere (TLT).
Warwick Hughes suggests that there has been a drift in the measurements since about 2005, such that calculated temperatures are too high, and we await a proposed correction. However, we can live with that.
Here are plots of TLT for various regions of the globe.
Fig.1: 12 month running means of Global anomalies and Tropical anomalies (the region of the Earth between 20 degrees North and 20 South, which gets the majority of the solar radiation striking the Earth).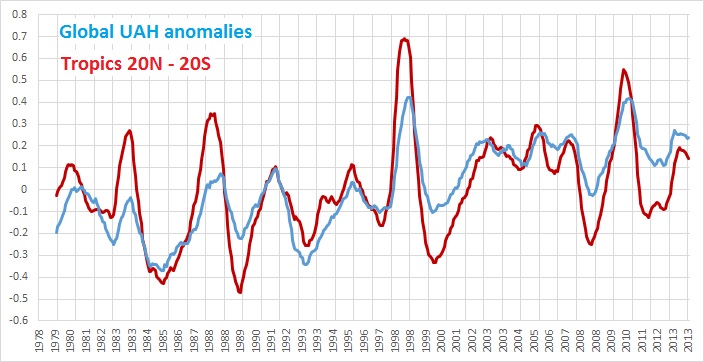
The two sets move in lock step, with a much larger variation in the Tropics than the world as a whole.
What causes these large variations?
Fig. 2: Global and Tropical anomalies with the SOI inverted, and scaled by a factor of 30.
SOI is the acronym for the Southern Oscillation Index, calculated from pressure differences between Tahiti and Darwin, and is a reasonably good indicator of El Nino or La Nina conditions. The ENSO cycle (El Nino Southern Oscillation) originates in the tropical Pacific. El Nino brings warmer temperatures to the world; La Nina is associated with cooler temperatures. I have inverted the SOI to show this relationship, and scaled it down by 30 to fit on the graph.
Note how the 12 month mean of SOI precedes the temperature data. Here’s a plot with the SOI advanced 5 months.
Fig.3: SOI advanced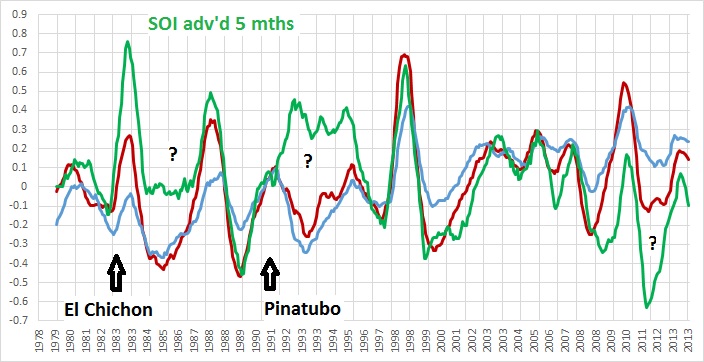
While the peaks (El Ninos) match very closely, I have marked periods following the major eruptions of El Chichon and Mt Pinatubo, which cooled temperatures for several years. I also suggest that the atmospheric dust and cooler surfaces upset the ENSO cycle as traced by the SOI. Note also that temperatures in the 2010-2011 La Nina appear higher than expected.
Fig.4: SOI advanced with Tropic and Australian land TLT.
Note how Australian temperatures appear to fluctuate about as much as the Tropics (we’re one third north of 20S after all). Australian temperatures are influenced by events in the Indian Ocean and Southern Ocean as well as the Pacific, so the match isn’t exact.
I will look at Australian data specifically in another post.
Finally, here’s a way to check on that other “finger print” of the enhanced greenhouse effect, as espoused by Dr Karl Braganza: land areas are expected to warm faster than oceans, supposedly showing that greenhouse gases, not ocean currents, drive global warming.
Fig. 5: Global Land and Ocean TLT.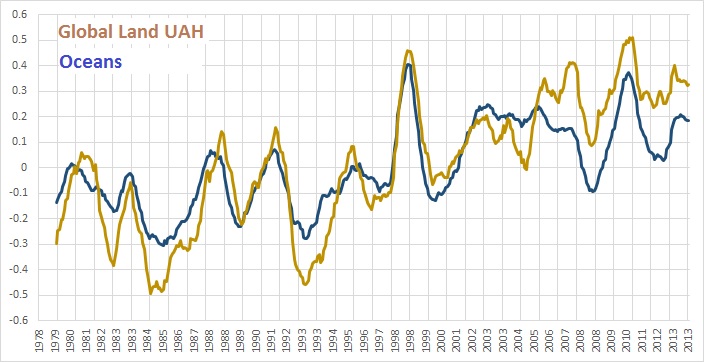
Well of course that proves it- land areas are indeed warming faster than oceans.
However, have a closer look at the timing of the switches between warming and cooling. If well mixed greenhouse gases are warming both land and oceans, it would be expected that oceans, with higher specific heat and enormous thermal inertia, would take longer to warm. The land response would be almost immediate. Oceans would not be expected to warm before the land, and if anything might show a slight lag.
Fig.6: close up of the 1998 Super El Nino.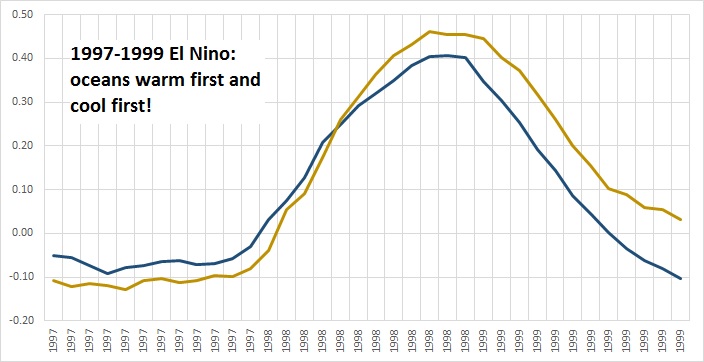
The oceans change phase about one month before the land. They definitely do not lag behind.
And what causes these rapid changes?
Fig.7: Land, ocean, and the SOI advanced 5 months.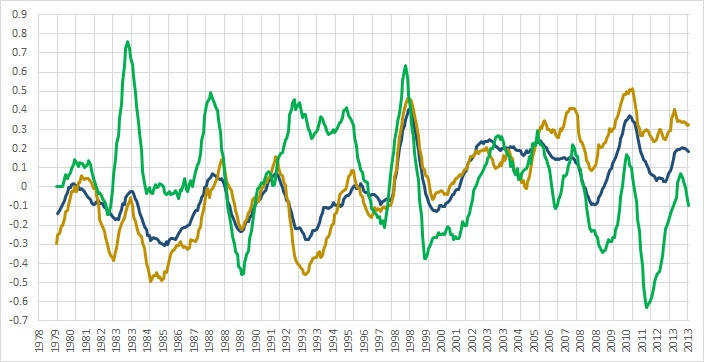
The world’s temperatures respond to the powerful beat of ENSO events- as well as large explosive volcanic
Tags: climate, Dr Braganza, El Nino, enhanced greenhouse effect, La Nina, UAH

February 5, 2014 at 3:46 pm
Totally agree that ENSO ‘maketh the difference’, Ken.
Just for fun, these are the average max means for the past 20 years in 5 year lots.
1994 -1998: +0.352C (affected by El Nino)
1999-2003: +0.206 (affected by La Nina)
2004-2008: +0.618 (affected by El Nino)
2009-2013: +0.23 (affected by La Nina)
These figures are about correct if you use the adjusted 2013 graph rather than the 2011 graph.
Why so low the past few years? 2011 with a -1.15C almost cancelled out 2013 with a +1.20C.
If you cherrypick 1979 – 1983 you get just over 0.3C (El Nino/neutral).
February 21, 2014 at 1:46 pm
ENSO a primary contributor to interannual temps, oceanic origin. No surprise ocean leads land on interannual scales. This is evident in the literature and temp records.
ENSO fluctuates around a mean, so no inconsistency that land temps have trended faster than sea surace over the long term. Different time scale, apples/oranges.
February 21, 2014 at 5:15 pm
So we agree… I think. Not sure about the apples and oranges though.
February 22, 2014 at 11:29 am
I may have misunderstood.
February 23, 2014 at 10:53 am
Didn’t see these other comments when I got home last night, and it was past my bedtime anyway…
Nope, can’t agree. Decadal UAH means and also smoothed first differences clearly show oceans leading land.
February 23, 2014 at 3:27 pm
Let’s look again at the posit you are challenging:
If you are claiming that the opposite is true, then global sea surface temps should have warmed more than land over the satellite period. UAH says:
Global Ocean – 0.11C/decade
Global Land – 0.19C/decade
Land has warmed faster than oceans (sea surface) according to UAH data.
February 23, 2014 at 5:43 pm
Yes Berynn, if you had read my post you would have seen my somewhat sarcastic line, “Well of course that proves it- land areas are indeed warming faster than oceans.” As they should for any type of warming. But oceans change phase BEFORE land, which is not what is supposed to happen with greenhouse warming.
This is becoming circular, and here I am repeating my post for your benefit, which is a waste of my time.
February 23, 2014 at 8:05 pm
This is, as far as I know, a unique hypothesis. No one contends that greenhouse warming will, for example, somehow cause ENSO events to originate from land surface instead of the ocean.
The error in your post is conflating phase change timing with rates of warming. They are separate issues.
February 24, 2014 at 12:07 pm
Braganza contends that warming is not driven by ocean processes. Because of thermal inertia, in any sort of warming, greenhouse or otherwise, not originating in the oceans, the oceans should not start warming before land- warming should be at best simultaneous or show a lag in the oceans. Therefore, if oceans change phase before land, this argument is invalidated, and ocean processes can not be ruled out. Observations show (a) oceans changing phase before land, and (b) all major global warming and cooling events of the last 34 years being strongly linked to ENSO, which is most assuredly an ocean process. Warming from any cause at all will result in land warming faster than oceans, and also cooling will result in land cooling faster than oceans.
There, once again I have summarised my post for you, but I don’t expect it will make much difference.
February 24, 2014 at 6:54 pm
It does not make a difference because in summarizing your post, you have recommited the error of analysis.
I imagine Barganza argues that ocean processes are not responsible for long-term warming (climate change), but I doubt he espouses that this should prevent short-term ocean-led changes from ENSO (weather fluctuation). You conflate climate-scale changes with in-system weather fluctuations.
ENSO does influence land temps and global temp trends, mainly observable on short time scales (a succession of la Ninas recently has flattened the surface temp trend for the last 17 years or so, for instance), but barely existent for multidecadal time scales, which we agree is how climate is defined.
[Just seen on another thread you’re not partial to the way I comment. I’ll take the hint and wish you well]
February 25, 2014 at 6:00 am
Good morning Barry,
As you can see your comments go to moderation from now on. Thanks for coming.