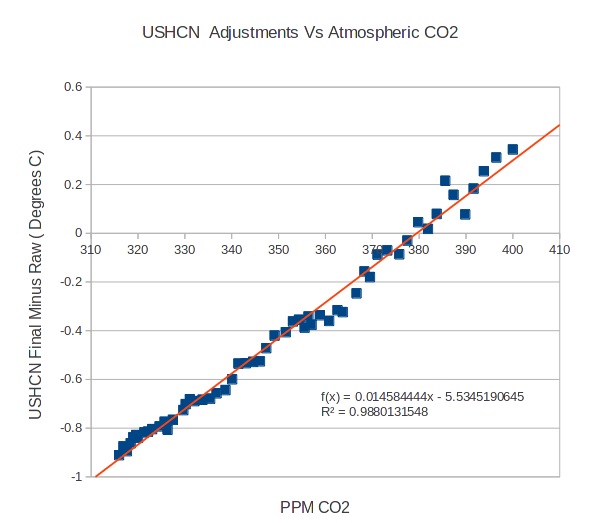
Steven Goddard has posted about the remarkable correlation between USHCN adjustments and atmospheric carbon dioxide concentrations:
Here’s my plot of Australian adjustments to minima, Acorn minus raw vs CO2 data (downloaded from NASA GISS at
http://data.giss.nasa.gov/modelforce/ghgases/Fig1A.ext.txt ):

R2= 0.777 not as impressive as 0.988, so not proof of anything except past cooling adjustments which we already knew. Interesting all the same.
Tags: adjustments, Bureau of Meteorology, CO2

August 4, 2014 at 10:53 am
Thanks Ken. I was not aware of Steve Goddard’s announcement. R^2 at 0.988? GISS may as well have plotted all values on the line.
August 5, 2014 at 11:08 am
The Australian correlation is not 0.99, but at 0.78 its still very good. With atmospheric CO2 on the X-axis essentially a proxy for the date, the new Goddard plot of CO2 ppm plus the RAW-ACORN adjustment together on the Y-axis vs year on the X-axis would also be interesting.
Doesn’t it just show that BOM have systematically lowered older temperatures, and raised modern temperatures to match the rising CO2 plot? Isn’t is suspicious that all of the earliest temperature adjustments are a lowering?
What if GISS in the USA, BOM in Australia, NIWA in NZ and Met Office in UK have all systematically adjusted raw temperature data the same way?
August 6, 2014 at 7:56 am
Dave, it just shows that raw temperatures were adjusted down in the past. The correlation with date is far better- +0.91.
August 29, 2014 at 12:33 am
I think you have to de-trend data before computing correlation coefficients, otherwise there is a very spooky correlation between my weight and the sea level, both of which have risen nearly linearly over the past few decades.
April 26, 2018 at 5:28 pm
[…] Safe Steroids Store Safe Steroids Store Safe Steroids Store Safe Steroids Store Safe Steroids Store Safe Steroids Store Safe Steroids Store Safe Steroids Store Safe Steroids Store Safe Steroids Store Safe Steroids Store […]