Recently I briefly posted about Brisbane, using 29.5 C as the heatwave bench mark. Silly me- after checking Dr Perkins’ site (Scorcher) I now understand that Dr Perkins was not calculating a single bench mark temperature for a heatwave. She calculates benchmark temperatures for every single day of the year. Temperatures in the top 10% for each date for three days in a row constitute a heatwave- including in winter. Thus Brisbane can have a heatwave in mid-July if the temperature is over 22.4 degrees for three days. Some heatwave! A real scorcher! Only one winter ‘heatwave’ has ever been over 30 degrees (33.7 C in 2009).
It is interesting that Dr Perkins’ website, Scorcher! has this caveat on the front page: “Scorcher.org.au is intended as an educational site. It should not be used for any policy decisions and comes with no warranty.”
However, silly as it sounds for winters, I decided to attempt to replicate Dr Perkins’ heatwave findings for Brisbane. For the years 1961 to 1990, I sorted each month’s days from hottest to coldest, and found the value for the top 10 percent of each month. I then used this value for each month, and calculated a centred 31 day running mean to give a benchmark value for each day of the year. This value is used to flag days hot enough, and if there are three or more in a row, there’s your ‘heatwave’. Rough and ready, and probably a very different method to Dr Perkins’, but values for heatwave benchmarks should be similar- if anything, a little low. Results are graphed below.
Fig.1: Seasonal count of heatwave days, showing that yes, the number of heatwave days has increased.
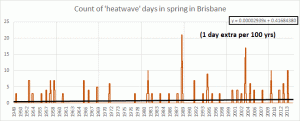
Fig.2: Spring count of heatwave days (Benchmark ranges from 24.8 to 30.1 C)
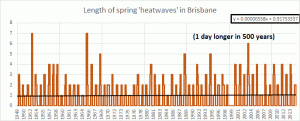
Fig.3: Length of spring heatwaves
Fig.4: Temperatures of spring heatwaves
Fig.5: Number of heatwaves in spring
So yes, by this definition it is correct to say in spring Brisbane has slightly more heatwaves, which have more heatwave days, are slightly longer, and very slightly warmer, if you trust linear trends as an analysis tool for such non-linear data- (without the linear trend line and equation, it is difficult to see any trend in heatwave days, duration, or temperature).
However, the results for other seasons are also revealing.
Fig.6: Temperatures of summer heatwaves (Benchmark ranges from 30.1 to 30.9C)
Fig.7: Temperatures of winter ‘heatwaves’ (Benchmark ranges from 22.4 to 24.7 C)
Fig.8: Temperatures of autumn ‘heatwaves’ (Benchmark ranges from 24.3 to 30.2 C)
Winter, summer, and spring all have slightly more and warmer heatwave days (summer heatwaves are 0.2 degree warmer after 65 years, winter ‘heatwaves’ will be half a degree warmer in 900 years!), but autumn is declining in all areas- length, temperature, and number. Funny that Dr Perkins didn’t mention Brisbane autumns.
And the most important thing about Brisbane heatwaves is not included in Dr Perkins definition- humidity.
Tags: heatwaves


March 15, 2015 at 2:16 pm
Useful contribution Ken.
Perkins is not a meteorologist and her site is NOT educational; it’s not even informative.
Just been having a clean out and came across some re-prints. One was Conover and Iman 1981:
people.umass.edu/bioep740/topics/amstat-1985-iman.pdf
Have you thought about converting your data to ranks (equal ranks tied) (not a bad transformation for stochastic data). Then analyse using ordinary least squares.
March 15, 2015 at 5:02 pm
But Perkins’ paper is the one used to justify the recent claims about increased heatwaves. There are many ways of analysing the data and I’m not at all happy about defining heatwaves in such a way, but I’m doing it to compare apples with apples but keeping as simple as possible. I’d be interested to see what you have come up with.
March 17, 2015 at 9:56 am
Temperatures in the top 10% for each date for three days in a row constitute a heatwave- including in winter.
You have GOT to be kidding me! If there is a more dishonest field of practice, I don’t know it…maybe New York investment banking, but not much else.
April 19, 2015 at 7:01 am
[…] Further Reading Bogus data in Australian Temperature Records: https://kenskingdom.wordpress.com/2015/03/14/acorn-updated-but-not-improved-result-the-same-bogus-data/ Brisbane temperature benchmarks change daily: https://kenskingdom.wordpress.com/2015/03/15/how-hot-is-brisbane-with-new-improved-daily-benchmarks/ […]