The OpenNEM website gives access to several ways of viewing Australia’s electricity usage. One I like shows Flexibilty. Figure 1 shows plots for the week to Tuesday 11th July of consumption sourced from Variable (wind and solar), Fast Flexible (gas, hydro, diesel, battery), and Slow Flexible (black coal and brown coal). I chose this period because it includes Tuesday 4th, Friday 7th and Saturday 8th, and illustrates just how variable the Variables can be.
Figure 1: Screenshot of Flexibilty, NEM

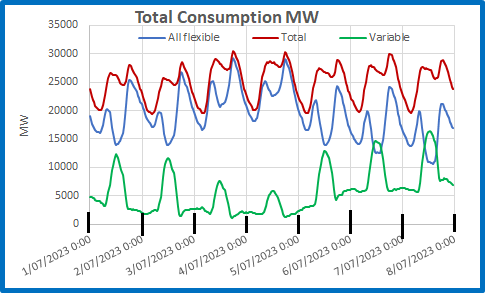
Obviously, when Variables are high Flexibles are low and vice versa. Notice that Variables have one peak at noon each day, as solar generation far exceeds wind- in daylight hours, but Flexibles have two peaks each day, morning and evening. Figure 2 is my plot for the first week of July, combining all non-variables and showing the total consumption:
Figure 2: Total Consumption 1-7 July 2023
The total (red) shows the two peaks, morning and evening, and the overnight dip to baseload at about 20,000 MW. Note that variable generation (green) has a midday peak due to solar that rapidly descends with the sun to a night time level far below baseload.
Note also that on the evenings of the 3rd and 4th total consumption is made up almost entirely of flexible generation- variable was only 3.4% of the total on the 3rd and 3.9% on the 4th.
The next figures contrast conditions on the best day of the week for variables with those on the worst day.
Figure 3: 4th July Consumption- Worst for Variables
Monday and Tuesday, the 3rd and 4th, saw extensive cloud cover and rain over much of eastern Australia, especially Queensland, while winds were very light in the south. This was the worst day for wind and solar, peaking at about 6,000 MW at 12.30, dropping to 1,170 MW at 6 pm. Conversely, it was the best day for coal generators who could maintain steady generation all day. Contrast this with the 7th:
Figure 4: 7th July Consumption- Best Day for Variables
The sun was out and the wind was fair. This was a great day for wind and solar, producing 60% of all electricity needed in the middle of the day. Note how coal fired generators had to decrease then increase very rapidly (nearly 80% increase from 3 pm to 6.30 pm). That’s not how they were designed to operate.
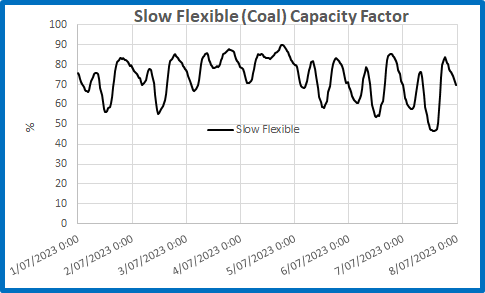
Electricity statistics for the first week of July show how thoroughly weather-dependent are wind and solar. However, they also show the resilience of non-variable generation, and show the excellent Capacity Factor that coal can achieve. Capacity Factor is the actual generation as a percentage of nameplate capacity.
Figure 5: Coal generation Capacity Factor 1 -7 July 2023
Even with Callide C out of action until next year, coal’s capacity factor dropped below 50% only on the 8th. It peaked at over 80% on every day of the weak, averaged 73.6% and reached 90% on the 4th. While wind’s capacity factor was at 94% on the evening of the 7th, at 5.30 pm on the 3rd it was only 9.7%, and at that same time solar capacity factor was practically zero.
Thank goodness for variable generation, which adjusts to the vagaries of wind and solar. In Australia, even fossil fuelled electricity is dependent on the weather.
In my next post I will show why you shouldn’t expect batteries and hydro dams to come to the rescue anytime soon.
(Source: OpenNEM)


July 18, 2023 at 12:33 pm |
Thanks, Ken
One has to wonder how Blackout Bowen can be so blind/naive to believe that renewables are efficient, effective, cheaper than any other source and, to top it off, are going to save the world from thermogeddon.
July 18, 2023 at 3:08 pm |
He doesn’t have to believe it, he just has to get enough people to believe it.
July 19, 2023 at 9:50 am |
All the hills around here are cluttering up with wind turbines. Amazing how many times i see them stationary. Also wonder if the wind goes around the areas where they are dense now.