In previous posts (here and here) I have shown how maximum temperatures (Tmax) as recorded by ACORN-SAT (Australian Climate Observations Reference Network- Surface Air Temperature- ‘Acorn’ for short) have diverged from other measures of climate change, in particular, rainfall.
I’ll continue looking at the Tmax ~ Rainfall relationship, and show how the Bureau of Meteorology (BOM) must never have used it as a quality control measure for temperature recording. Result: garbage.
Tmax is negatively correlated with rainfall. Wet years are cooler, dry years are warmer. If the incoming solar radiation, the landscape and the measuring sites remain the same, over a number of years this physical relationship remains constant. What is true of rainfall and temperature in my lifetime was also true in my grandfather’s lifetime, and will still be true in my grandchildren’s lifetime. If the relationship appears to vary, it must be as a result of some other cause, such as:
changes in solar radiation;
changes in the landscape (urban development, tree clearing, irrigation);
changes in the weather station sites (movement to new sites, tree growth, proximity to heat sources, buildings, or areas of pavement, change of screen size);
changes in measuring equipment or methods (electronic probes instead of mercury in glass, time of observation, recording in Celsius instead of Fahrenheit, millimetres instead of inches); or
changes in the recorded data (wrong dates applied, or adjustments).
Solar exposure has not changed (and it would be a huge problem for Global Warming Enthusiasts and the whole Climate Change industry if it had). Across Australia, urban development is a minuscule fraction of land area; tree clearing and irrigation have affected a larger area in several regions, but the vast arid interior remains largely unchanged. We do know however that weather station sites, observation methods, and equipment have changed, and temperature data (and to a much smaller extent, rainfall data) have been “homogenized” in an attempt to correct for these changes.
The 1961 – 1990 Tmax ~ rainfall relationship
The Bureau of Meteorology uses the period from 1961 to 1990 as the baseline for calculating temperature and rainfall means and anomalies. Figure 1 shows the relationship between Tmax and Rainfall for all years from 1961 to 1990. I am using BOM data from their Climate Change Time Series page.
Fig. 1: Annual Tmax plotted against Rainfall, 1961 – 1990

The x-axis represents rainfall, the y-axis represents maximum temperatures. The trendline is marked, showing Tmax decreases with rainfall.
In the top left is the trendline label, showing the value for Tmax (y) for the any value of rainfall (x). I have magnified this in Figure 2.
Fig. 2: Trendline label, Tmax vs Rain 1961-90

Circled in red is the slope of the trendline (-0.0029: there is an inverse relationship, with temperature decreasing 0.0029 of a degree Celsius for every extra millimeter of rain).
Circled in green is the intercept (+29.9476: if rainfall was zero, the trendline would intercept the y-axis at 29.9476 degrees).
Circled in blue is the R-squared value (0.3744: R^2 indicates how well Tmax and rainfall match, 0 being not at all and 1 being perfectly. This value indicates a correlation of about -0.61. Another way of thinking about it is that 37% of Tmax is explained by rainfall.)
Now this is important: the relationship shown in the trendline label should be similar for the whole record, or else something other than the climate has changed.
I will now show how we can use the information in Figure 1 to test the accuracy of Tmax data in three separate ways.
Comparison of Acorn Tmax with theoretical values derived from rainfall.
Using the trendline equation (Tmax = -0.0029 x Rain + 29.9476) we can calculate an estimate of Tmax from rainfall in any given year. Figure 3 shows the result.
Fig. 3: 1910 – 2020 Acorn Tmax and Theoretical Tmax calculated from rainfall
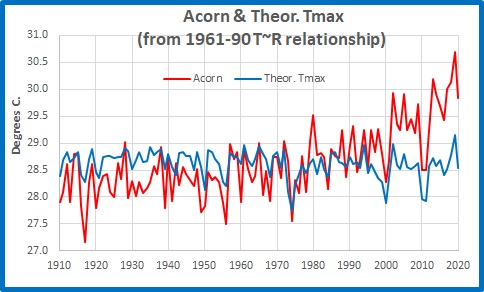
For most of the 1961-90 period there is a fair match (37%, remember). Before the mid-1950s Tmax is mostly lower than the rainfall derived estimate, and after 1990 is nearly always very much higher than we would expect for the rainfall.
A plot of annual differences between Acorn Tmax and Theoretical Tmax (the residuals if you like), the Tmax variation that is not explained by rainfall, shows how much they differ.
Fig. 4: Annual Differences: Acorn Tmax minus Theoretical Tmax

We would expect some random differences, but not that much and not strongly trending up.
Correlation between Tmax and rain over time
The next figure shows the “goodness of fit” between Tmax and Rainfall from any given year to 2020. (The plotline stops at 2010 as correlation fluctuates too much with only a few datapoints.)
Fig. 5: Running R-squared values of Tmax vs Rain for all years to 2010, from any given year to 2020

The relationship plainly changes (and improves) with time. From 1998 to 2020 there is a good correlation between Tmax and rainfall: before this it is woeful.
The next figure shows running 21 year calculations of R-squared ‘goodness of fit’ between annual maxima and rainfall, and is included for your entertainment.
Fig. 6: Centred running 21 year R-squared values of Tmax vs Rainfall

In 1989, the 21 year period from 1979 to 1999 has a correlation between Tmax and Rain of -0.35: less than 12 % of temperature change is explained by rainfall. 20 years later, the value for 1999 to 2019 is -0.9, or 81% of Tmax explained by rainfall. That amount of difference is farcical.
Moreover, recent data shows a completely different Tmax~Rain relationship from Figure 1.
Which brings me to the third point.
Change in Tmax ~ Rainfall relationship over time
From the trendline equation in Figure 2, the Tmax ~ Rainfall relationship may be calculated as
(Tmax – intercept)/ Rainfall. The value for 1961-90 is -0.29C per 100mm.
This plot of the 21 year moving average shows how much this changes.
Fig. 7: 21 Year Centred Running Average of ((Tmax – intercept)/Rainfall) x 100

The expected value of -0.29C/ 100mm is reached from 1973 to 1976, in the middle of the 1961 – 1990 period, as expected. Based on the 1961-1990 trendline equation, over the last 21 years 100mm of rain reduces Tmax by one tenth of a degree Celsius (and if we extrapolate- not a good idea- that figure will approach zero in about 10 years’ time). 100 years ago that same 100mm of rain would have reduced Tmax by 0.38 degrees. Why has rain lost its power?
Conclusion
Three plots of the Tmax ~ Rainfall relationship- Figures 4, 5, and 7- show a similar pattern of change in the difference between recorded and theoretical Tmax, the correlation between Tmax and rainfall, and the Tmax ~ Rainfall equation.
Why has rain lost its power? It hasn’t- Tmax has become relatively too high. Historical maximum temperatures as reported in Acorn are not just inaccurate but deeply flawed.
The Acorn dataset is garbage.
