Archive for the ‘floods’ Category

Extreme Weather Events 3: Sydney

January 29, 2023

Are extreme weather events showing up in Australia’s largest city?

Floods and bushfires might affect smaller areas, but droughts, heatwaves, and very heavy rainfall from large weather systems affect large areas. All of the above have occurred near Sydney in the past few years: surely there should be visible signs in temperature and rainfall.
First, rainfall.


In July and October 2022 flooding affected the western Sydney region again, with The Conversation of course saying “climate change is projected to bring far worse extreme rain events than in the past.”

For long term rainfall I look at Sydney’s longest rain records, at Observatory Hill and the Botanic Gardens. Figure 1 shows their location.


Figure 1: Central Sydney, courtesy of Google Maps

Observatory Hill rain records start in July 1858, but the original data ends in August 2020. I choose not to splice data from old and new gauges. Botanic Gardens start in 1885 but there is a large gap, with continuous data from late 1909 to the present. Figures 2 and 3 plot daily rainfall for each:


Figure 2: Observatory Hill daily rain

Figure 3: Botanic Gardens daily rain (1910 to 2022)

Long term means:


Figure 4: 10 year running means of rainfall at Observatory Hill and Botanic Gardens

Note that the means are similar until about 2010 when they start to diverge. Reasons might include changes to the sites. Rainfall was clearly higher in several previous decades.


Figure 5: 10 year running Standard Deviations

There was much greater variability in Sydney’s rainfall for most of the 50 years from 1950 to 2000. To show Standard Deviation relative to mean rainfall:


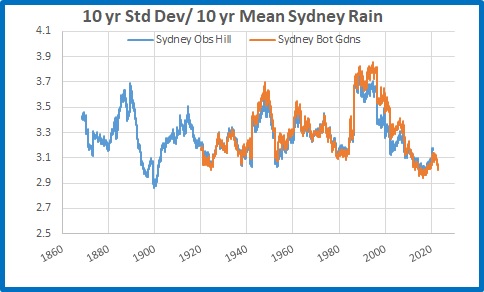
Figure 6: 10 year running Standard Deviations divided by 10 year means

Which shows there is little daily variability in rainfall in recent years, and both sites are comparable.


I will now analyse Botanic Gardens data in more detail.


Figure 7: Running 365 day means

2022 was the wettest year on record, followed by 1950.


Rainfall accumulated over several days is a factor in large scale riverine flooding such as occurred in Sydney’s west.


Figure 8: Four day total rainfall

Clearly there were many much greater 4 day rain events in the past than in the latest floods.


I measure “droughts” by counting the number of days with less than 4mm of rain in running 365 day periods.


Figure 9: Running 365 day counts of days with under 4mm of rain

2022 was by far the most consistently wet. There is no sign of increased drought in Sydney.


Conversely, do recent years have more days with high rainfall?


Figure 10: Running 365 day counts of days with over 100mm of rain

No. Only 3 days in 2022, while 1999 had 5, and many others in previous years had more than 2022. It seems that the Sydney region, going by the Botanic Gardens rain gauge, has less extreme rainfall than the past.


I now analyse temperature at Sydney Observatory Hill, using the latest version of Acorn to 2021, and Climate Data Online for 2022 and January 2023 up to Australia Day.


Figure 11: Daily Maxima Sydney Observatory Hill 1910 to 26/1/2023

Maximum temperatures in Sydney, according to the best the Bureau can provide, have warmed at 0.9 degrees Celsius per 100 years. Decadal means show an almost identical trend.


Figure 12: 10 year mean Tmax

Standard Deviation measures daily variability, and 10 year mean Standard Deviations show some interesting patterns:


Figure 13: 10 year running Standard Deviation, Sydney Tmax

Variability is greater with higher temperatures and less with lower temperatures, and temperatures should be related to rainfall- because a dry period will have hotter days and usually cooler nights. Temperature adjustments might interfere with this.


Whatever, there were several past periods with higher Standard Deviations than the past decade, and when divided by the 10 year means the contrast is even greater:


Figure 14: 10 year running Standard Deviations divided by 10 year means

Are days getting hotter? Well, years are, mostly:


Figure 15: 365 day running means of Tmax

Highest and lowest daily maxima in 365 day periods are not co-operating:


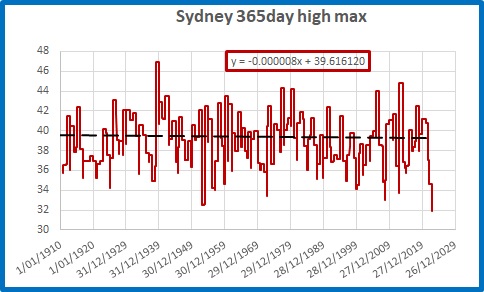
Figure 16: Highest Tmax in 365 day periods

The hottest day was back in 1939, and 2022 had the lowest “hottest day” in a 365 day period on record, with the hottest day being 31.9 degrees.


Figure 17: Lowest Tmax in 365 day periods

Several past winters had cooler maxima.


But is Sydney getting more frequent hot and very hot days?

Figure 18: Running 10 year counts of days over 34.9 degrees

Figure 19: Running 10 year counts of days over 39.9 degrees

The last 10 years have had fewer hot and very hot days than in the past.


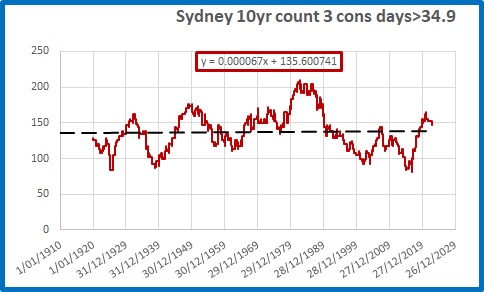
What about heat waves, when there are strings of hot days? The definition appears to have changed, but if we consider three hot days in a row to be a heat wave:


Figure 20: Running 10 year counts of 3 consecutive days over 34.9 degrees

There is a very small trend (0.8 in 100 years) but there were many more 3 day heatwaves in the past.


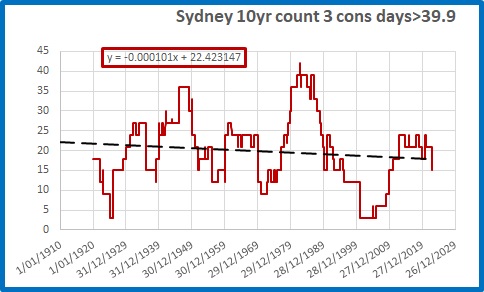
Figure 21: Running 10 year counts of 3 consecutive days over 39.9 degrees

There is a decreasing trend of very hot heat waves (more than 3 less per 100 years), with nearly three times as many 3 day heatwaves of 40 degrees or more in the 10 years to 1982 as in the past 10 years.


Conclusion:


Contrary to popular belief encouraged by politicians and the media, in Australia’s largest city it is clear that:


Rainfall and temperature variability is LOWER than in the past


Droughts are NOT increasing


Extreme rainfall is NOT increasing


Dry years are NOT increasing


Very hot days are DECREASING in frequency


Heatwaves are NOT increasing and are very much LESS COMMON than 40 years ago.


If anything, Sydney’s weather is becoming less extreme and more benign. That should be good news.


We are still waiting for the “projections” of more extreme weather to arrive.

Extreme Weather Events: 2

January 20, 2023

Further to my post yesterday about the Climate Council’s recent fear mongering, with my look at whether the recent flooding at Fitzroy Crossing could be due to increasingly severe rain events, here are two more locations.

I calculate the 10 year running standard deviation of daily rainfall, the 10 year mean, and because the standard deviation must change as the mean changes, I divide the 10 year standard deviation by the 10 year mean.

Early this year there was sever flooding in northern New South Wales. Brays Creek is near Mt Warning about 40 km north of Lismore. Here is the standard deviation divided by average rainfall:

Rainfall over the past 10 years is less extreme than it was 40 to 50 years ago.

The Bruce Highway to north Queensland was blocked for several days, as it normally is every Wet season, by flooding at Goorganga Plains just south of Proserpine. Is rainfall becoming more extreme? Here is the raingauge at Lethebrook, using the same technique.

Nothing exciting to see there either.

Extreme Weather Events: 1

January 19, 2023

Last night On Wednesday night 18 January, the Climate Council released their latest doomsday publication, with the support of Beyond Blue (they’re now off my list of charities to donate to.)

“HIDDEN MENTAL HEALTH TOLL OF WORSENING CLIMATE DISASTERS ON AUSTRALIANS REVEALED WITH NEW NATIONAL POLL”


Climate Councillor, climate scientist at the Australian National University and author of Humanity’s Moment: a Climate Scientist’s Case for Hope, Dr Joelle Gergis said: “The results of this poll are confronting. It’s heartbreaking to realise that many Australians are living with significant levels of distress related to the reality of our changing climate. It shines a light on this invisible mental health crisis that is undermining the stability of our local communities all over the country.

“We need to have a national conversation about climate change adaptation and listen to the experiences of people who have lived through these disasters.

Extreme weather events are going to escalate as our planet continues to warm, so the impacts we have witnessed in recent years are really just the tip of the iceberg. We urgently need to develop plans that protect and support our local communities as climate change-fuelled disasters continue to upend the lives of countless Australians.”

Time for a reality check:

Is there evidence of increasing climate extremes?  Rainfall and temperature are easily measured and data is freely available from the BOM.

First example:  The recent flooding at Fitzroy Crossing. 

A useful measure of extremes is Standard Deviation.  For this technique I am indebted to Willis Eschenbach whose recent post at WattsUpWithThat sparked my interest.

I calculate the 10 year running standard deviation of daily rainfall, the 10 year mean, and because the standard deviation must change as the mean changes, I divide the 10 year standard deviation by the 10 year mean.

The nearest rain gauge with a reasonably long record is Fossil Downs.  Here is the 10 year average daily rainfall:

As you can see average daily rainfall (which nearly all falls in the Wet) has nearly doubled since the decades to the 1960s.

10 year standard deviation:

No wonder people are anxious!  The 10 year figure is very high (but not as high as the 1980s!  Was it more extreme 40 to 50 years ago?)

But here is the standard deviation divided by average rainfall:

This shows that relative to the average, rainfall extremes are actually getting smaller.

Over the next few days I will show rainfall and temperature plots for several Australian cities.  Stay tuned.

Is Australia Getting Harder To Live In?

March 23, 2022

Update: see link below kindly supplied by Big M

According to Scomo it is.

And are natural disasters becoming worse and more frequent?

If you listen to or look at commentary in the mass media and social media, largely fuelled by politicians and journalists with no contact with nature and no life experience, you might think so.

The Conversation says:

It’s too soon to say whether the current floods are directly linked to climate change. But we know such disasters are becoming more frequent and severe as the climate heats up.

Time for a reality check.

Flood and fire and famine are the three great normals of Australia, as so well expressed by Dorothea McKellar in My Country, and we in the north also have cyclones.   

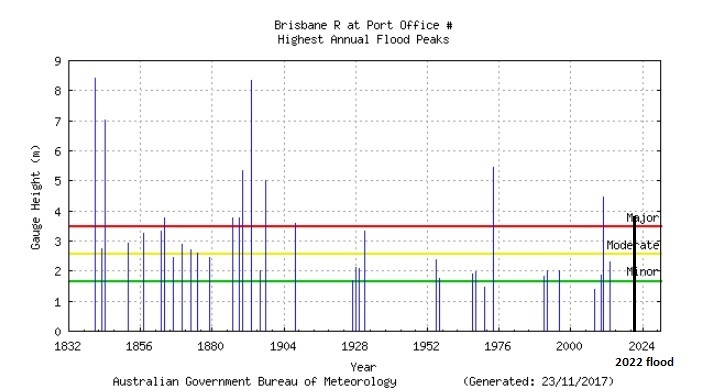
First, floods.  Brisbane was hit hard by floods last month.  Figure 1 is from a previous post, showing historic floods in the Brisbane River with the 2022 flood inserted.  No cause for alarm there.

Figure 1: Historic Brisbane Flood heights 

What about fatalities?  Figure 2 shows the 2022 floods compared with some historic floods from all over Australia.  Fatalities are totalled if several floods occurred in one year.

Figure 2:  Death tolls of flooding events

Are flood disasters getting deadlier? No.

Fatalities and housing damage are the result of people living in flood prone areas- or from being trapped in vehicles in rising waters.   After the 1916 flood, the people of Clermont in Queensland moved their town to higher ground- without any government assistance.  This photo from Bonzle shows the Commercial Hotel being moved on log rollers by a steam traction engine.  The Commercial is still standing- I’ve had a few coldies there.

Figure 3: Moving the Commercial Hotel to higher ground

And no one asked where Billy Hughes was.

What about fires?

Figure 4 shows the area of land burnt by bushfires by notable fires across Australia.  I have marked some fires that are fairly well known- but does anyone mention the fires of the 1960s and 1970s?  These were in largely savannah country of WA, Queensland, and the NT.

Figure 4:  Area Burnt by Bushfires

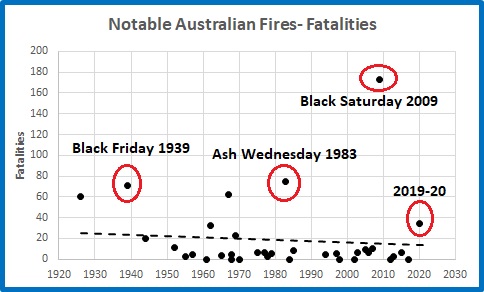
Figure 5 shows fatalities due to bushfires.

Figure 5:  Bushfire Fatalities 1920-2020

Despite the terrible 2009 fires, fatalities due to bushfires in the last 100 years have been trending down.  Lessons must be learned from these tragic events.  We should remember that fire is part of the Australian bush.  Many fatalities occur where housing is surrounded by bushland, with poor escape routes.

The downtrend in fire fatalities is even more apparent when you consider Australia’s population has grown enormously since 1920.  The following plot shows how the risk of death by bushfire has changed.

Figure 6:  Bushfire Fatalities per 1,000 people 1920-2020

No, by no measure are bushfires getting worse, or making Australia harder to live in.

Droughts are also in decline across most of Australia.  The following plots use BOM data.

Figure 7:  Percentage of Land in Severe Drought (lowest 10% of rainfall)

Even though 2019 was an extremely dry year, over 120 years the area of land in drought is decreasing at the rate of 0.23% per decade.

The only areas where drought has increased are Southwestern Western Australia, Victoria, and southern South Australia. 

In southern Australia as a whole, there is no trend in droughts, even with the 2018-2019 drought.

Decadal averages are an excellent way of showing long term patterns.  In southern Australia the worst period of long lasting dry years was the 60 years from 1920 to 1980.

Figure 8:  Percentage of Land in Severe Drought- Decadal Averages Southern Australia

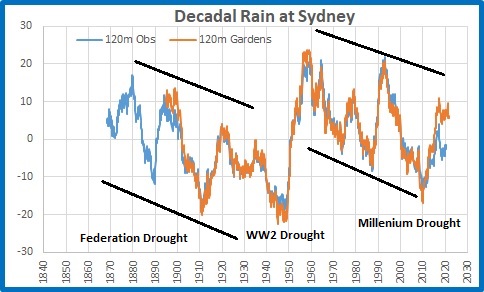
But are dry periods getting drier, and wet periods wetter?  And are dry areas getting drier, and wet areas wetter?  Here are long term rainfall records for Sydney, Cairns (very wet) and Alice Springs (very dry), and Adelaide (drying trend) again with decadal means.  Values are anomalies from months of overlap of weather stations, in millimetres of rain.

Figure 9:  Decadal Mean Rainfall- Sydney

The three major droughts stand out, as does the major reset of the 1950s.  Note the decreasing values to the 1940s, and again from the 1960s.  There is no indication of wet periods getting wetter and dry periods drier.

Figure 10:  Decadal Mean Rainfall- Cairns

Figure 11:  Decadal Mean Rainfall- Alice Springs

It seems that dry periods are getting wetter at Cairns and Alice Springs, and apart from the 1970s-1980s, wet periods show no great difference.

Figure 12:  Decadal Mean Rainfall- Adelaide

Here we see the gradual fall off in rainfall in southern SA, gradually since the 1930s but more rapidly since the 1970s.  The shift in the Southern Annular Mode has caused drying in southern parts of the continent.  It is too early to draw any conclusions from that.

The alternately wet – dry feature of Australian climate is obvious from all the above plots.  However, wet periods are not getting wetter, and dry periods are not getting drier.

What about cyclones?  Here is a plot straight from the Bureau:

Figure 13:  Tropical Cyclones 1970-2021

Cyclones are NOT becoming more frequent or more severe.  The trend is clearly downwards.

Finally, heatwaves.  In reality we have no idea, as the temperature record managed by the Bureau is so bastardised- as shown here, here, here, here, here, and here.  We just don’t know, no matter what they claim.

Those who live in the cities, who have little contact with nature, and who have no knowledge of the history of Australia’s climate, will accept whatever they’re told about natural disasters as gospel.  The truth is different.

Scomo has nothing to worry about (apart from the next election).  Australia is NOT getting harder to live in: floods, fires, droughts, and cyclones are NOT getting worse or more frequent. 

UPDATE: Big M has kindly supplied this link, which I missed.

https://www.abc.net.au/news/2021-05-26/australias-hidden-history-of-megadroughts/100160174

The 1760s WA drought seems to match data from the Barrier Reef showing a 30 year drought in NQ.

How Unusual Is All This Rain We’ve Had?

March 3, 2022

Yesterday, 2nd March, ABC weather reporter Kate Doyle posed this question on the ABC website about the recent rain event in SE Queensland and Northern NSW.

Her answer to the above question was:

Very unusual.

The rainfall totals from this event have been staggering. 

From 9am Thursday to 9am Monday three stations recorded over a metre of rain:

– 1637mm at Mount Glorious, QLD 
– 1180mm at Pomona, QLD
– 1094mm at Bracken Ridge “

She goes on to say:  “South-east Queensland and northern NSW are historically flood prone and have certainly flooded before but this event is definitely different from those we have seen in the past.”  And of course climate change is involved.

Time for a reality check. 

My answer to Kate’s question:  Not very unusual at all.

I went looking at Climate Data Online for four day rainfall totals over one metre, to compare with the recent totals above at Mount Glorious, Pomona, and Bracken Ridge. 

For a start, Pomona’s BOM station has been closed for years, and Bracken Ridge is not listed at all, so those reports are from rain gauges external to the BOM network and can’t be checked. 

That’s OK.  In about half an hour I found the following four day rainfall records.

Crohamhurst4/2/18931963.6mm
Yandina3/2/18931597.8mm
Tully Sugar Mill13/02/19271421.3mm
Palmwoods4/2/18931244.6mm
Buderim3/2/18931150.3mm
Bloomsbury20/01/19701141.8mm
Dalrymple Heights6/04/19891141mm
Innisfail3/04/19111075.8mm
Nambour11/1/18981013mm

1893 was a wet year!  Crohamhurst had 2023.8 in five days, and Brisbane had three floods in two weeks in February and another in June.

And there is no such thing as a “rain bomb”, a term invented to make it sound unprecedented.  This was an entirely natural and normal rain event.  Slow moving tropical lows drift south every few years in the wet season, producing a large proportion of Queensland’s average rainfall.

Floods have affected Brisbane and surrounds since before European settlement.  The Bureau has an excellent compilation of accounts of past floods at

http://www.bom.gov.au/qld/flood/fld_history/brisbane_history.shtml

It includes this graphic showing the height of known floods.  I have added an indication of the height of the 2022 flood.

Here are some notable Brisbane floods:

1825       a flood probably as high as the 1893 flood

1841       8.43m

1844       about1.2 metres lower than 1841

1864       ?

1887       ?

1889       ?

1890       ?

1893       8.35m

“              8.09m

“              ?

“              ?

1908       4.48m

1974       5.45m

2011       4.46m

2022       3.85m

Every flood is different- water backs up higher in unexpected places, or gets away faster, so for many people this flood was worse than 2011.  However it is beyond any doubt that this flood, heartbreaking as it was for many people, could have been much worse.  It was nowhere near as big as several in the past.  Wivenhoe Dam worked as planned this time, which greatly lessened the impact.

Another thing worth remembering:  floods were more frequent and higher in the 19th Century than they have been in the last 100 years.

ABC journalists need to do a lot more research.