Since the first talk of an agreement between China and the Solomon Islands to establish a Chinese presence there, accusations have flown thick and fast between the Australian government and their opponents.
One of the points of contention is whether Australia’s supposed lack of urgency in addressing climate change has led to distrust of Australia by Pacific island nations, thus encouraging them to seek help from China. Considering China’s record and plans for emissions, that is hardly likely. However, The Guardian thinks so, saying two days ago:
There might not be a direct link between Australia’s climate policy and the security deal – Morrison certainly thinks there isn’t, dismissing such a connection as “nonsense” today – but it is without doubt that Australia’s climate policy has contributed to the dimming of Australia’s reputation in the region, especially given Australia claims to be family.
So is climate change – specifically sea level rise- threatening the Solomons?
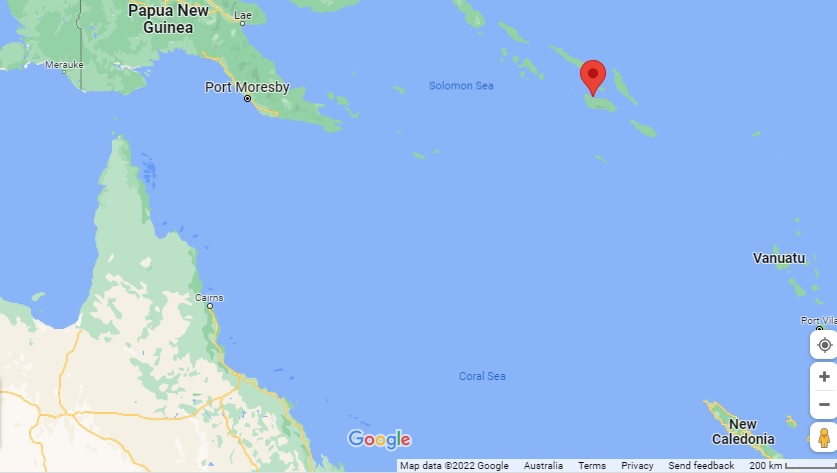
Time for a reality check. Here is a map courtesy of Google, showing where the tide gauge in the Solomons is in relation to Australia.
Figure 1: Solomons tide gauge location
Not that far away.
Over the last 28 years since the BOM began monitoring sea level at Honiara, sea level has definitely risen. Figure 2 shows monthly anomalies of mean tidal data.
Figure 2: Monthly mean sea level, Honiara
Oh no! Climate change!
Figure 3 shows inverted mean barometric pressure anomalies plotted with mean sea level.
Figure 3: Monthly sea level and barometric pressure (inverted)
Hmm. As air pressure falls, sea level rises, and vice versa. Figure 4 shows 12 month means (from July to June, which covers most ENSO events):
Figure 4: 12 month means of monthly sea level and inverted barometric pressure
Still not a close match, but let’s include the effect of the trade winds (data from NOAA).
12 month means of trade wind anomalies, scaled down by a factor of 10 show a much better match:
Figure 5: 12 month means of monthly sea level and scaled trade winds index
Now we see the connection, and cause of the apparent trend in sea level- the combination of air pressure and trade winds. Barometric pressure has been decreasing, and trade wind strength has increased. These are symptoms of the El Nino Southern Oscillation (ENSO). When atmospheric pressure is unusually high (as in very big El Ninos), sea levels are lower, mainly because the normal trade winds slacken and less water than normal is pushed westwards across the Pacific. As trade winds strengthen, more water is pushed westwards and sea level rises. (This also affects the eastern coast of Australia, and strengthens the East Australian current as well.)
When we get the next big El Nino (cue droughts, bushfires, and wailing and gnashing of teeth) it is likely that the sea level trend will mysteriously flatten.
Sorry, guys, unless climate change predicts fewer and weaker El Ninos, climate change is not to blame: and certainly not the Australian government.
It’s all about the money.


