In previous posts I checked three of Dr Karl Braganza’s “fingerprints” of climate change he listed in an article in The Conversation on 14/06/2011(my bold):
These fingerprints show the entire climate system has changed in ways that are consistent with increasing greenhouse gases and an enhanced greenhouse effect. They also show that recent, long term changes are inconsistent with a range of natural causes…..
…Patterns of temperature change that are uniquely associated with the enhanced greenhouse effect, and which have been observed in the real world include:
- greater warming in polar regions than tropical regions
- greater warming over the continents than the oceans
- greater warming of night time temperatures than daytime temperatures
- greater warming in winter compared with summer
- a pattern of cooling in the high atmosphere (stratosphere) with simultaneous warming in the lower atmosphere (tropopause).
I will look at the 2nd point above, that is, greater continental than oceanic warming.
Time for another reality check.
This is possibly the silliest of Dr Braganza’s claims. It does not need very great understanding of physics, meteorology, or geography, to see that continents will warm faster than oceans as a result of ANY cause- greenhouse or otherwise- and on any timeframe.
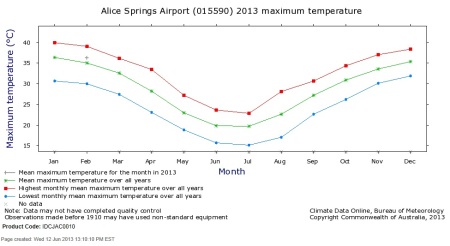
Let’s consider two temperature stations maintained by the Bureau of Meteorology (BOM)- Willis Island 200283, in the middle of the Coral Sea, and Alice Springs 015590, in the middle of Australia.
First, let’s look at a 72 hour timeframe. Compare these two graphs:
Now here are graphs of monthly mean maxima:
Finally, these graphs plot anomalies- Maxima:
(The trends are not important except to show that they vary more at Alice Springs, and the year-to-year range is greater.)
On all timescales, whether warming is caused by daily, seasonal, or inter-annual factors, Alice Springs warms (and cools) much more rapidly than Willis Island. Perhaps the specific heat of water compared with land has something to do with it?
Now let’s look at the global picture. These graphs use data from the University of Alabama (Huntsville) satellite record (UAH) to show the December 1978-May 2013 comparison for Land and Ocean from 85N to 85S.
Practically identical trend lines for Land and Ocean!
Finally, Southern Polar (60-85S)
Once again it is obvious that “Global” Warming is predominantly a Northern Hemisphere phenomenon. The Southern Hemisphere refuses to follow Dr Braganza’s claim.
Further, the greater the proportion of land to ocean (Northern Hemisphere), the more land warms relative to the oceans.
Far from being a pattern of temperature change uniquely associated with the enhanced greenhouse effect, this illustrates the higher thermal response of land compared with water. The only band where the temperature range of the ocean is close to that of the land is the Tropics, which is mostly ocean, and which is the driver of world climate.
Conclusion:
Dr Karl Braganza again has made an assertion that is demonstrably false. He has failed to explain that any warming will be greater on land than on water and this is not a unique indicator of greenhouse warming. He should have said that recent, long term changes are consistent with a range of natural causes
FOUR of his fingerprints of climate change are missing.


