Archive for June, 2022

Blowin’ in the Wind

June 22, 2022

The energy crisis seems to be ongoing- the new normal apparently.  Is it the fault of old, rundown coal fired power stations with breakdowns?  Is it the fault of greedy, profit hungry energy suppliers gaming the system?  Is it the fault of the Ukraine war pushing up coal and gas prices?  Is it the fault of the previous coalition government for not having the correct climate policy, resulting in not enough investment in renewables?  Or all of the above?

Nope.

Breakdowns last week in under-funded power stations didn’t help, nor a shortage of high priced coal and gas.  And you can’t blame companies wanting to keep their income above their costs. 

But no amount of climate ambition, and no possible amount of renewable capacity, could have averted the problems we’ve had last week and are likely to continue to have.

Figure 1 shows our electricity consumption for the two weeks from 3rd to 17th June. 

Figure 1:  All NEM electricity consumption 3- 17 June

Coal is the heavy lifter.

Figure 2 shows the main energy sources as a percentage of the total usage.

Figure 2:  All sources as a percentage of NEM electricity consumption 3- 17 June

Note again it is coal followed by daylight- and I don’t mean solar!  Note also that coal’s relative contribution increased despite breakdowns and supply difficulties.

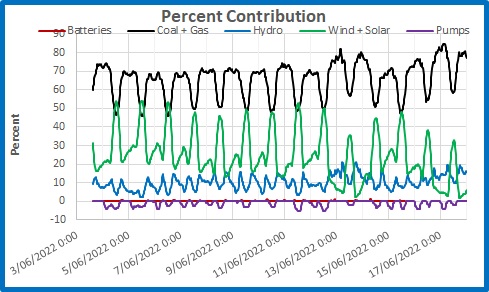
The next plot shows the percentage contribution of fossil fuels and all non-fossil sources- batteries, hydro, wind and solar.  I’ve also included the negative contribution of pumped hydro, when dams are refilled using excess electricity- except on 13th and 14th when it was too expensive.

Figure 3:  Fossil and non-fossil generation as a percentage of consumption

Renewable energy advocates like averages- they hide a multitude of sins.  Here are the averages of all sources for each 30 minutes of the day for the last two weeks:

Figure 4:  Average 30 minute NEM electricity consumption 3- 17 June

Coal varies between 12,000 and 16,000 MW per half hour as it responds to the twice daily peaks in demand, and the daily peak in solar output.  Solar is useless for meeting baseload around 4:00 a.m., or either of the daily peaks.  Wind averages a touch over 4,000 MW all day so is also no help with extra demand.  Battery discharge at peak times can barely be seen.  Gas and hydro vary at similar rates to meet demand when needed, though gas output remains higher throughout the night.

How reliable was wind generation, which averaged over 4,000 MW per half hour?  Here is a plot of actual wind generation at 30 minute intervals from 3 June to 17 June:

Figure 5:  Actual wind generation 3- 17 June for each half hour

“Fickle” is not an adequate description.

Of course renewables can provide 18,000 MW at maximum capacity- but at the wrong time of the day.  When the need was greatest, they could provide only 6,880 MW- and 90% of that was hydro.

Our entire electricity generation, including fossil generation, depends on the reliability or otherwise of renewable generation.

Our energy crisis last week was not caused by breakdowns, fossil fuel prices, greedy power companies, coalition governments, or lack of investment in renewables.

It was caused by a lack of wind.

Figure 6:  Actual wind generation 3- 17 June

We are hostages to the weather.  Bob Dylan was right.  The answer is blowin’ in the wind.

(Source: OpenNEM)

The Gap

June 18, 2022

Here is a simple plot to demonstrate the challenge facing our new government, and all future governments, if they want to transition to a zero carbon economy.

This is the gap between all non-fossil fuel generated electricity- solar, wind, and hydro- and total consumption in eastern Australia over the past two weeks (3rd to 17th of June) for every 30 minutes of the day.

That gap- 12,000 to 16,000 MW for base load and 16,000 to 30,000 MW for peak load- is now filled by gas and coal.  Snowy 2.0 will only provide an extra 2,000 MW of storage.

That’s just for electricity- don’t forget electric vehicles and hydrogen!

(Source: OpenNEM)

The Real Cost of Renewables

June 13, 2022

Electricity prices are increasing, we know.  Here is a plot of electricity prices across the eastern states in the National Electricity Market.

Fig. 1:  NEM Prices 2009-2022

There is a shortage of available coal and gas generation, resulting in record prices.

Fig. 2:  NEM Coal & Gas Prices 2009-2022

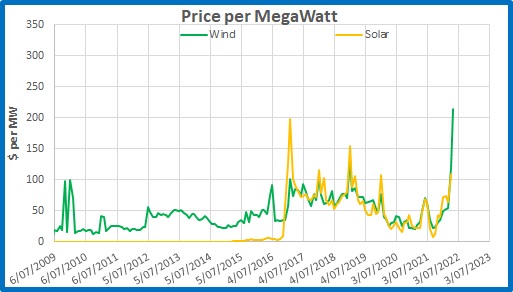
Of course wind and solar are much cheaper:

Fig. 3:  NEM Wind & Solar Prices 2009-2022

See?  Renewables are cheaper.

Not so fast.

Figure 4 shows electricity consumption for the eastern states last week (Friday 3 June to Friday 10 June).

Fig. 4:  NEM Total Consumption 3 June – 10 June

Note the daily cycle between baseload and peak load.  Figure 5 is a plot of consumption for each 30 minutes of the day:

Fig. 5:  NEM Total Consumption by Time of Day

The baseload- the minimum amount of electricity to meet the needs of streetlights, hospitals, smelters, and households- occurs every day between about 3.30 a.m. and 5.00 a.m., and last week was from 20,600 to 22,300 MW.

Peak load rose to 35,386 MW.

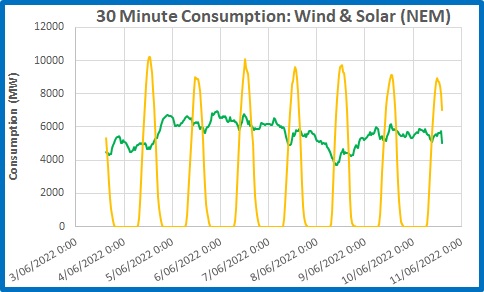
Figure 6 shows how wind and solar performed last week:

Fig. 6:  NEM Wind & Solar Consumption 3 June – 10 June

The bleeding obvious is that while solar provided more than 10,000 MW for 30 minutes on Saturday 4 June, it produced absolutely zero every night.  Wind never reached 7,000 MW.

That’s the reason we need storage.  If we can store the excess from solar, we could use it to supplement wind when needed.  Much money has been invested in large scale batteries.  However, batteries provided a maximum output of 324 MW last week- pathetic really.

We do have hydro-electricity, mainly in Tasmania and the Snowy Mountains.  Figure 7 shows how hydro contributed last week:

Fig. 7:  NEM Hydro Consumption 3 June – 10 June

Hydro helped twice a day at peak times, and also provided a substantial supply in daylight hours- over 2,000 MW on 8 June.  The previous week- at 6 p.m. on Thursday 2 June- wind could manage only 3% of the NEM load, and hydro provided 19.33%, or 5,382 MW.  Last Thursday 9 June at 6 p.m. hydro provided 5,519 MW.

That’s why we need more storage.  Forget batteries- the only realistic storage is pumped hydro, where excess off-peak electricity is used to pump water to storage dams.  Wivenhoe Dam in Queensland has been doing this for 40 years.

So the politicians dreamed up Snowy 2.0.  This scheme, whose timeline for completion has blown out to the end of 2026 according to Chris Bowen (Weekend Australian June 11-12), will cost 4.5 billion dollars to build, plus another $1.5 billion to $2 billion for extra transmission lines.

 “Snowy 2.0 will provide an additional 2,000 megawatts of dispatchable, on-demand generating capacity and approximately 350,000 megawatt hours of large-scale storage to the National Electricity Market. To provide context, this is enough energy storage to power three million homes over the course of a week.”

That’s a cost of $3.25 million per MW.

That’s the “good” news.  Now for the interesting news.

As we saw above, baseload last week was 20,000 to 22,000 MW- and winter has only just started.  If fossil fuels are removed eventually, baseload at 4 a.m. must be met by some combination of wind and hydro as there is no sun at that time of day. 

The current hydro capacity is 9,285 MW.  Snowy 2.0 will provide an extra 2,000 MW.

The current installed capacity of wind generation is 9,202 MW- and that is going full bore day and night, with optimum wind conditions and no stops for maintenance.  32% of capacity is the average reached.

The total installed capacity of wind, current hydro, and Snowy 2.0 is 20,487 MW.  That is still short of baseload with winter to come, and peak load last week was 35,386 MW.  That doesn’t allow for population increase or economic growth either.  Where will the extra 15,000 MW of wind powered and pumped hydro electricity come from?  It’s an impossible dream.

But wait, there’s more.

Here’s the bad news:  Hydro electricity is the most expensive electricity in Australia- more expensive than either coal or gas.  In May 2022 it reached $315.91 per MW.

Because it is rapidly despatchable it is sold at times of very high demand, so the operators get top dollar.  Much more than coal or gas.

Figure 8 shows the average price of hydro for each month to May 2022.

Fig. 8:  NEM Hydro Prices 2009-2022

The real cost of renewables will include the cost of storage and emergency supply.

Don’t hold your breath hoping for electricity prices to come down.

Energy Crisis or Ideology Crisis?  The Rubber hits the Road

June 7, 2022

Australia faces an energy crisis as electricity prices escalate, as we were told by the media last week.  Last Thursday evening at 6:00 p.m. the spot price for electricity hit $4,335 per Megawatt Hour.  Blame was immediately cast on our aging fleet of coal fired power stations.  Several were operating well under capacity through planned maintenance or unexpected failures.  Gas powered stations ramped up, but gas costs an arm and a leg because of the Ukraine war.  The weather had turned very cold in southern states and the wind had dropped. 

What shall we do?

Well, firstly, don’t panic.

Secondly, don’t depend on renewables.

Thirdly, enjoy the abundance of fossil fuel powered electricity- don’t restrict it.

And finally, if you must insist on Net Zero by 2050, go nuclear.

Here’s why.

Don’t panic:

Despite our apparently aging, decrepit, obsolete fleet of coal fired power stations operating at only 58% of capacity for the last seven days (10:30 a.m. Tuesday 31 May to Tuesday 7 June) the lights stayed on- just.  Gas and hydro came to the rescue.  With better maintenance and planning, there would have been no problem at all, and no need for cutbacks to industrial production such as aluminium.  So there’s no need to panic- we have ample energy supply.

Figure 1 shows electricity generation for the seven days to Sunday 5 June (p.m.) from OpenNEM.

The vertical line shows 6:00 p.m. Thursday night when the spot price peaked at $4,335.  It was after sundown so no solar, and there was little wind.  The plot shows how gas and hydro ramped up.  Also note the peaks on Monday, Tuesday and Wednesday were higher, and on the weekend demand was lower, so excess electricity could be used to pump water for hydro.

Don’t depend on renewables:

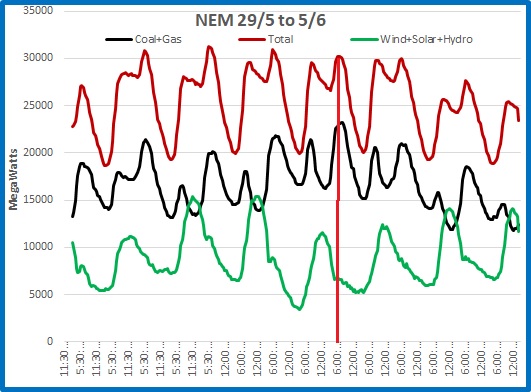
Figure 2 shows the same data as Figure 1 but not stacked, so comparison is easier.

Figure 2: All generation 29 May to 5 June (2:30 p.m.)

Coal of course stands out- nothing comes near.  Note that daylight hours are easy to see from the solar peaks.  Wind varies up and down as weather systems move across.  To fill the gaps on either side of solar, hydro and gas peak together in early mornings and evenings.  And finally you can barely see the contribution of batteries and diesel generators.

Figure 3 shows the relative contributions to the total of fossil fuels and renewables.

Figure 3:  Fossil fuels and wind, solar, and hydro:

The total generation has a daily cycle to match demand, but never dropped below 18,600 MW at night.  That is the minimum that the eastern Australian network must supply at this time of year.  The total rose to a touch under 31,300 MW in the early evening of Monday, Tuesday, and Wednesday, with excess power used to pump water for hydro, reducing to about 30,000 on Thursday and Friday as industries and commerce cut back, and much lower peaks on the weekend.  Note that renewables fluctuate much more than coal and gas.

Figure 4 looks at the percentage contribution of the “old” generation- coal, gas, and hydro- compared with the new- wind and solar.

Figure 4:  Old and new as a percentage of total generation:

Wind plus solar only exceed 50% on sunny, windy days.  Because they get preferential treatment coal stations must cut back at these times.  When wind or solar- or both- cannot meet demand, fossil fuels and hydro must quickly ramp up.  On Thursday night wind and solar contributed just 3% of electricity.

That’s why we cannot depend on renewables.

Enjoy the abundance of fossil fuels:

Coal capacity is 23,049MW.

Gas capacity is 10,967MW.

Together that is 8 percent more than the maximum of all generation on any day of the last week.  Coal alone could easily meet night-time needs.

Hydro-electricity averaged another 9% (peaking at 19.4%).

With proper planning and maintenance that should be a decent buffer for unexpected breakdowns.

Of course gas is very expensive because of global demand.  With more coal generation (HELE power stations) we could have a reliable and cheaper electricity network, without any need for solar or wind power except in remote or special locations.

If you must insist on Net Zero by 2050, go nuclear:

There is no other realistic choice.

34,000 Megawatts of fossil fuelled electricity can be phased out, but on last week’s figures we MUST have at least 31,000 MW or we will have cut backs in industry, commerce, services, and domestic supply.  And last week, at one stage only 665 MW was being generated by wind turbines, and each night there is zero from all the rooftop and solar farm capacity in the country.   Hydro?  We have frequent droughts, so that cannot be relied upon in the long term.

Even in the sunniest continent on earth, and with the usually strong winds across southern Australia, renewables cannot be relied on when needed.  If there is to be limited fossil fuel use, the only alternative is nuclear energy.

I look forward to watching the Greens and Labor squirm over the next few years.

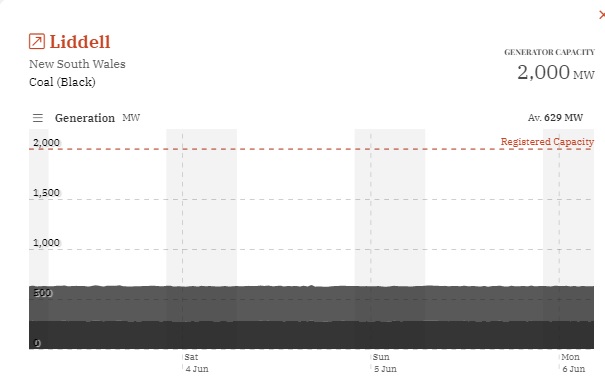
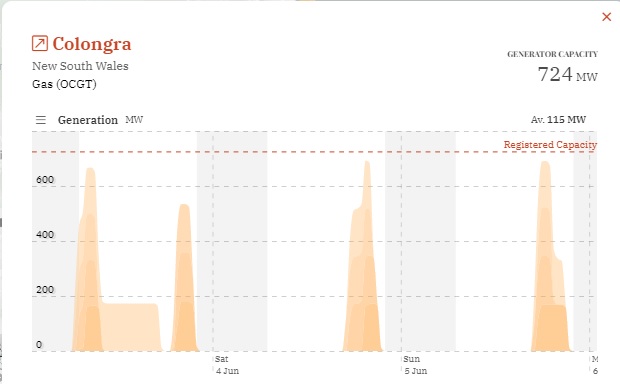
I have included as an Appendix a sample of the major electricity facilities so you can see how their generation varied over the last week.

Appendix:  Electricity generation from a sample of coal, gas, hydro, wind and solar facilities last Friday, Saturday, and Sunday

Coal can ramp up and down as needed- but is hard to do and harder on the equipment.

Gas can quickly fill the gap but is expensive- and sits idle for a long time too.

Hydro is quick to ramp up and down but dams have to have enough water.

Wind is free but doesn’t always blow!

Likewise, sunshine is free but not always there!