Here is a point in time snapshot of electricity generation across the eastern states of Australia, in five simple plots.
Figure 1: Total Installed Capacity of all Electricity Generators at 14 February 2023
Note that while coal is still king, rooftop solar capacity is rapidly gaining. Figure 2 shows relative capacity in a pie chart:
Figure 2: Percentage of Total Capacity
If you are any good at Maths you will see that fossil fuels account for just over 45% of generation capacity while renewables (including hydro) account for almost 55%.
Figure 3 looks at actual generation for the year from 14/2/22 to 6/2/23- 52 weeks- in a pie chart.
Figure 3: Percentage of Total Generation over 52 weeks
Now that is interesting: coal supplied 58% of electricity generation from just 30% of generating capacity. Renewables, with 55% of capacity could only manage 36% of actual supply. Gas made up the remaining 6%.
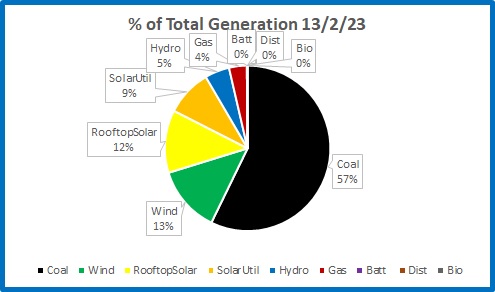
What about in one 24 hour period? Monday 13 February had close to ideal conditions for renewables: fine, sunny weather with the monsoon far to the north, moderate winds, and dams full. Figure 4 shows the percentage of total generation for one day:
Figure 4: Percentage of Total Generation on one day
Coal has slipped by one percent, gas by two percent for a total of 61%. In ideal conditions, renewables provided 39%.
Knowing the installed capacity for all generators and the actual electricity supplied we can calculate the capacity factor of each:
Figure 5: Capacity Factor for all Generators 13/2/23
Coal 62.13%
Wind 32.93%
Solar (Utility) 32.85%
Hydro 19.60%
Rooftop Solar 17.29%
Gas 8.24%
Battery 3.38%
Distillate 1.14%
Bioenergy -0.15%
(-0.15% for bioenergy? That’s not a typo: when sugar mills are not crushing, bioenergy is a drain on the network.)
Solar farms are nearly twice as efficient as roof top solar, for the simple reason that rooftop panels are usually fixed while panels in solar farms track the sun. Maximum capacity factor for a solar farm could in theory approach 50%, while that of household solar, no matter how much installation increases, won’t get much higher than now.
You can be assured that wind and solar are generating as much as possible. Coal and gas must reduce supply to allow for this- if it wasn’t for renewables they would have a much higher capacity factor. This is a problem renewables will never be able to solve- wind and solar energy are too diffuse to be much more efficient.
I hate waste.
We will see how this compares in winter, with much less sunshine and Liddell coal fired power station closed.
(Source: OpenNEM)


