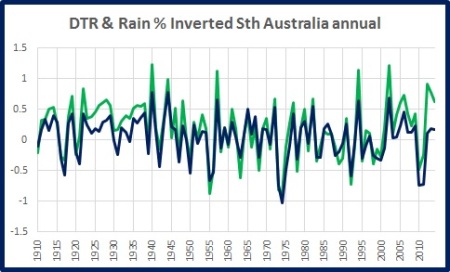
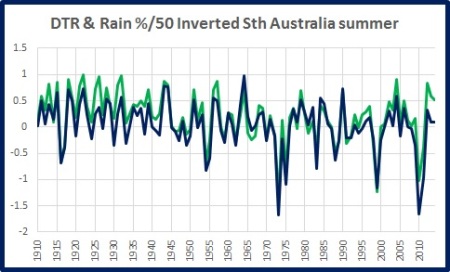
In my last brief post I showed how Diurnal Temperature Range is related to rainfall in Northern and Southern Australia in Northern and Southern wet seasons (which correspond roughly to summer and winter).
In this post I show the relationship between DTR and daytime cloud, and between rainfall and daytime cloud, and something very peculiar about South-Western Australia.
All data are taken straight from the Bureau’s Climate Change Time Series page.
DTR is affected by rainfall through Tmax being cooled by cloud albedo, evaporation and transpiration, and Tmin warmed by night cloud and humidity. There must be a relationship between clouds and rain, although it is (rarely) possible to have rain falling from a clear sky with no visible cloud. Rain is easily measured in standard rain gauges. Cloud is calculated by trained observers, and we only have data for 9 a.m., 3 p.m., and daytime cloud. The data give no indication of cloud type, thickness, or altitude, just amount of sky covered (in oktas, or eighths).
Here I show scatterplots for Australia as a whole annually, and for Northern, South-Eastern, and South-Western Australia in summer and winter. I calculate both rainfall and cloud as percentage differences from their means.
Fig. 1: DTR vs Rain for Australia annually:

Fig. 2: DTR vs Cloud for Australia annually:

Notice much better correlation between DTR and Cloud.
Now let’s look at the relationship between rainfall and daytime cloud.
Fig. 3: Percentage difference in Rainfall vs percentage difference in Cloud for Australia annually:

Note a 10% increase in cloud cover could be expected to be associated with a 25% increase in rainfall.
Fig. 4: Percentage difference in Rainfall vs percentage difference in Cloud North Australian summers:
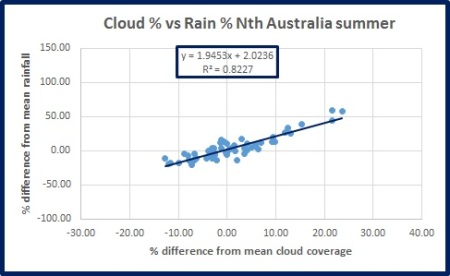
Fig. 5: Percentage difference in Rainfall vs percentage difference in Cloud North Australian winters:

Note how rainfall in the North Australian dry season varies proportionally more, but has a slightly lower correlation (>0.8 vs 0.9).
Fig. 6: Percentage difference in Rainfall vs percentage difference in Cloud South-East Australian summers:
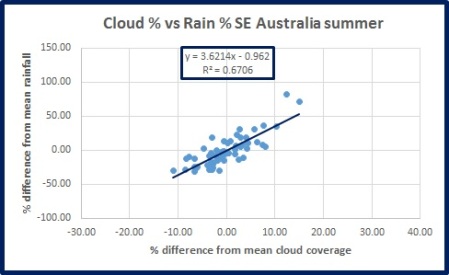
Note the much greater effect of cloud on rainfall in the southern dry season.
Fig. 7: Percentage difference in Rainfall vs percentage difference in Cloud South-East Australian winters:

Now, get ready for a surprise.
Fig. 8: Percentage difference in Rainfall vs percentage difference in Cloud South-West Australian summers:

Fig. 9: Percentage difference in Rainfall vs percentage difference in Cloud South-West Australian winters:

What’s going on in the south-west?
Here’s how DTR compares:
Fig. 10: DTR vs percentage difference in rainfall: South-west Australia

Similar relationship to everywhere else.
Fig. 11: DTR vs percentage difference in cloud cover: South-west Australia

And this graph clearly shows the relationship between rain and cloud is closer in the wet seasons, but also clearly shows that South-west Australia is an extreme outlier.
Fig. 12: R-squared comparison between rain and cloud in wet and dry seasons

Why the huge difference? There is no relationship between cloud and rain in south-west Australia, unlike everywhere else. The South-West has seen a marked decline in rainfall since the late 1960s, but an increase in cloud cover. It seems counter intuitive, but there you go.
Any suggestions are welcome.