UPDATE!
Firstly, I must apologise for the late posting. We went away for a two week road trip in early March, during which my laptop died. As well, we have had some family issues that have taken priority.
UAH v6.0 data for February have been released. Here are updated graphs for various regions showing the furthest back one can go to show a zero or negative trend (less than +0.1C/ 100 years) in lower tropospheric temperatures. Note: The satellite record commences in December 1978- now 37 years and 3 months long- 447 months. 12 month running means commence in November 1979.
Despite the record TLT for February, I am sorry to disappoint GWEs that The Pause has not disappeared. In some regions it has lengthened, in others it has shortened, and in the Northern Extra-Tropics it has disappeared (by my criterion)- but mostly it has remained at the same length.
[CLICK ON IMAGES TO ENLARGE]
Globe:

There has been zero trend for 18 years and 10 months.
Update: Some commenters (see below) think that use of 12 month running means are some form of trick to hide the data, and that using monthly data will show no Pause. Poor souls. Here is the graph of global monthly anomalies:

18 years 7 months- not much difference, and The Pause still lives!
Fools rush in….
Northern Hemisphere:

Southern Hemisphere:

For well over half the record the Southern Hemisphere has zero trend.
Tropics:

Tropical Oceans:

Northern Extra-Tropics (20-60N- where most people live):

The Pause has ceased in this region as the trend since July 1998 is a tad over +0.1C (+/- 0.1C) per 100 years.
Southern Hemisphere Extra-Tropics (mostly water):

But still strong in the South!
North Polar:

The Pause has lengthened by three months.
South Polar:

For the whole of the satellite record, the South Polar region has been cooling. So much for a fingerprint of warming due to the enhanced greenhouse effect being greater warming at the Poles!
Australia:
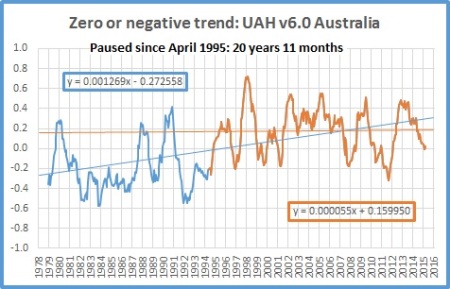
One month longer.
USA 49 states:
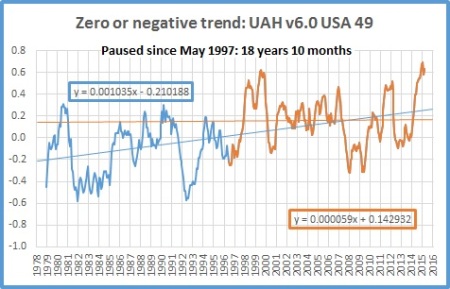
Despite all expectations to the contrary, The Pause lives on!
