It is now over three weeks (15 business days) since I questioned Dr Vertessy on his claims in his ABC Radio interview, but still no reply.
To test Dr Vertessy’s claim that we are seeing “of the order of five times the number of very serious heatwaves” as in the middle of last century, I have continued to use the following metric:
“Three days or more in a row in summer (December- February) where the maximum temperature is in the top 5% of temperatures for that day at that location, with daily benchmarks calculated using daily maxima for each month from 1961 to 1990.”
I have also used as an absolute metric of very hot days the Bureau’s own definition, days above 40 degrees Celsius. I have used ACORN-SAT maxima to 31 December 2014 downloaded directly from the Bureau’s Acorn site, and daily maxima from 1 January to 28 February this year for each site, downloaded from Climate Data Online. I have calculated decadal running counts of the number of days meeting the criterion to show how hot weather has changed over time.
In this post I have looked at rural locations to the north and west of Melbourne, including far western New South Wales and northern Victoria. Where there is a continuous ‘raw’ record, I compared with raw data.
Once again, results are mixed, but I also came up against the major difficulty in analysing Australian temperatures- missing data.
I’ll first show a group of locations that appear to support Dr Vertessy’s claim.- Deniliquin, Nhill, and Kerang.
Fig. 1: Decadal count of heatwave days in Deniliquin

Fig. 2: Decadal count of very hot days in Deniliquin

Fig. 3: Decadal count of heatwave days in Nhill

Fig. 4: Decadal count of very hot days in Nhill

Fig. 5: Decadal count of heatwave days in Kerang

Fig. 6: Decadal count of very hot days in Kerang

Deniliquin, Nhill, and Kerang all appear to show the present decadal count of both heatwave days in summer and very hot days to be very much greater than- 4 to 5 times greater than- that of the count to the mid 1950s. But next consider Tibooburra.
Fig. 7: Decadal count of heatwave days in Tibooburra

Acorn shows the recent peak, and the number of heatwave days in the decade to 1915 is about the same as the 1920s and 1940s- early 1950s. The raw record shows the current count is about the same or even less than in the 1950s.
Fig. 8: Decadal count of >40C days in Tibooburra
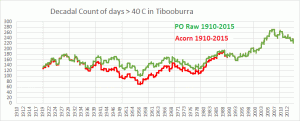
This shows a distinct rise to 2007, with a small decline since, but still above anything previous. However, consider the following.
Fig. 9: Decadal percentage of available data at Tibooburra

With up to a third of data missing in Acorn, the heatwave and very hot day counts are too low for more than two decades. The apparent dip in the decadal counts can be attributed to missing data.
This problem is as bad or worse at Nhill and Kerang.
Fig. 10: Decadal percentage of available data at Nhill

Fig. 11: Decadal percentage of available data at Kerang

A fair comparison is not possible. Only Deniliquin can conclusively confirm Dr Vertessy’s claim.
I now turn to Bourke, Cobar, Walgett, Mildura, and Rutherglen.
Fig. 12: Decadal count of heatwave days in Bourke

Fig. 13: Decadal count of very hot days in Bourke

Bourke has five to ten more heatwave days than in the 1950s, not five times more. (The peak 10 years ago got to twice as many.) The effect of adjustments can be clearly seen, but even Acorn shows the number of very hot days (>40C) is less than the 1920s.
Fig. 14: Decadal count of heatwave days in Cobar

Fig. 15: Decadal count of very hot days in Cobar

Cobar has recently had twice as many heatwave days as the 1950s, but less than the early 1930s, and the recent very hot day peak is less than the 1940s.
Fig. 16: Decadal count of heatwave days in Walgett

Fig. 17: Decadal count of very hot days in Walgett

Walgett has many fewer heatwave and very hot days than the 1940s. To 2015, the decadal count of heatwave days is half that of the mid 1950s.
Fig. 18: Decadal count of heatwave days in Mildura

Fig. 19: Decadal count of very hot days in Mildura

The recent/ current peak in decadal counts of very hot/ heatwave days is about twice that of the mid 1950s, but not markedly higher than the 1940s and late 1960s.
Rutherglen is interesting. Here is an example of how one extreme season can affect the record, with a large step up in the 1938-39 summer, but Acorn adjustments have increased the decadal count in the 1940s even more.
Fig. 20: Decadal count of heatwave days in Rutherglen

Fig. 21: Decadal count of very hot days in Rutherglen
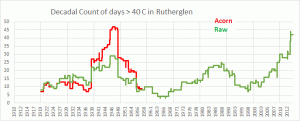
Acorn does not always cool the past. In Rutherglen adjustments have increased the number of very hot days in the record from 1939 to the late 1940s, garbling the climate record. Unfortunately for the Bureau, this shows heatwave days in the decade to 2015 a bit more than twice the number to 1955, but less than the 1940s.
And who knows how many heatwave days were between 1959 and 1965:
Fig. 22: Decadal percentage of available data at Rutherglen

Rutherglen has November 1959 to December 1965 missing, which makes comparison with the mid 20th century period somewhat difficult.
Conclusion:
So, are rural sites getting about five times more very serious heatwaves now compared with the middle of last century? At six of nine rural sites in western NSW and northern Victoria, No. Only Deniliquin definitely supports Dr Vertessy’s claim. While some sites (Nhill and Kerang) appear to support the claim, fair comparisons are not possible because up to a third of data is missing from crucial years. None of the other sites support his claim (although no doubt careful selection of comparison periods will allow global warming enthusiasts to agree with him). Most show similar or higher frequency of heatwave days than now, before the 1950s.
We are not getting more heatwaves.


