Archive for September, 2018

Tropical Cyclones and Global Warming: A Reality Check

September 15, 2018

Recently there was widespread media reporting of Queensland Emergency Services Minister Craig Crawford’s release of “a plan designed to help first responders get ready for future weather extremes.”

In the ABC Online report, these quotes from Mr Crawford are emphasised:

“There are plenty of people out there who are climate change sceptics… but the consensus is our fire seasons are getting hotter and longer and our flood and cyclone seasons are certainly getting stronger and more frequent.”

“If we’re going to have cyclones happening in parts of Queensland that they don’t normally happen right now it means that we’re going to have to expand all the areas where we have response training, capability and everything like that,” Mr Crawford said.

Cyclone seasons getting stronger and more frequent?  Cyclones happening in parts of Queensland that they don’t normally happen right now?  Time for a reality check.

The Bureau of Meteorology has a useful resource in its Southern Hemisphere Tropical Cyclone Data Portal  which shows the tracks of all cyclones since the 1969-1970 season.  By clicking on each track you find details of each.   This is the 2017/18 season:

Fig. 1:  Cyclones of the 2017/18 season

Cyclone portal

I have used it to look at all cyclones that have crossed the coast of Australia (and I have included TC Nancy which came very close and whose impact was strongly felt without actually crossing the coast.)  I have counted the cyclones that crossed the coast in every month from October 1969 to now, allocating them to those parts of the northern coastline that they predominantly affected- the north-west, Northern Territory, Gulf of Carpentaria and northern Cape York, north-east Queensland, south-east Queensland (south of the Tropic of Capricorn), and New South Wales.

So here are some facts to annoy our Global Warming Enthusiast friends, and to demonstrate how ill-informed our Emergency Services Minister is.

Fig. 2: Total number of cyclones per season

All cyclones Aust

There has been a decrease in the number of cyclones over the past 48 years, a rate of five less in 100 years.  There has been little change in Western Australian cyclones:

Fig. 3: Total number of cyclones per season hitting North-West Australia

All cyclones NW

Whereas there has been a very noticeable decrease on the east coast (Queensland and NSW):

Fig. 4: Total number of cyclones per season hitting the east coast

All cyclones East coast

which is well illustrated by this plot of cyclones crossing the Queensland coast south of the Tropic of Capricorn:

Fig. 5: Total number of cyclones per season hitting south-east Queensland

All cyclones SEQ

And these images of cyclone tracks are instructive:

Fig. 6: Cyclones of south-east Queensland 1969-1992

SEQ cyclones to 92

Fig. 7: Cyclones of south-east Queensland 1992-2018

SEQ cyclones since 92

Oswald, Marcia and Debbie crossed the coast north of the Tropic of Capricorn and were rain depressions by the time they reached the south-east.

The difference is obvious.  No cyclone has crossed the coast south of Yeppoon since TC Fran in 1992.  26 years without a cyclone- people (and Mr Crawford) forget we had three in 1971.  If we do get another one no doubt it will be blamed on climate change.

So what connection is there between temperature and cyclones?

Fig. 8:  Australian tropical cyclones as a function of sea surface temperature

All cyclones Aust vs sst trop

As temperatures go up, cyclones go down!

Fig. 9:  Australian tropical cyclones as a function of Southern Oscillation Index

All cyclones Aust vs soi

The SOI is an indicator of El Nino, La Nina, or neutral conditions.  According to the BOM, consistently below -7 indicates El Nino, and above +7 indicates La Nina.  It is obvious that there have been very few cyclones in seasons with El Nino conditions, with the vast majority in neutral or La Nina conditions, and higher SOI indicates greater likelihood of cyclones crossing the coast.  This is not new, and the Bureau makes this clear.

Fig. 10:  Tropical cyclones in La Nina years

BOM map la Nina

Fig. 11:  Tropical cyclones in El Nino years

BOM map el nino

Future trends:

The Bureau discusses future trends at length at http://www.bom.gov.au/cyclone/climatology/trends.shtml

but seems to base its conclusions entirely on climate models:

There remains uncertainty in the future change in tropical cyclone frequency (the number of tropical cyclones in a given period) projected by climate models, with a general tendency for models to project fewer tropical cyclones in the Australia region in the future climate and a greater proportion of the high intensity storms (stronger wind speeds and heavier rainfall).

This is the BOM plot of severe and non-severe cyclones, which includes all tropical cyclones from 90E to 160E south of the Equator, many of which remained well offshore.

Fig. 12: Severe and non-severe tropical cyclones

BOM graph

Is there any evidence for cyclones becoming stronger, if fewer?  According to the BOM’s history of cyclones, no.  This graph plots the number of cyclones rated as severe by the Bureau (<970 hPa central pressure at peak intensity- low pressure is a good predictor of wind speed).  Interestingly, Marcia and Debbie are not listed as severe, but are described as severe in their reports, and definitely were, so I have included them in the tally.

Fig. 13: Severe land-falling tropical cyclones

Severe cyclones Aust

And showing how the proportion of severe tropical cyclones as a percentage of all land-falling cyclones has changed:

Fig. 14: Proportion of land-falling tropical cyclones rated as severe

Severe cyclones Aust %

Tropical cyclones in the past 48 years have decreased in number and intensity, and the proportion of severe tropical cyclones has also decreased, although it is entirely likely that this situation could reverse due to natural variability.

The Government’s Response

The Queensland Government is concerned cyclones may strike further south than they currently do.  They have records of cyclones going back 150 years.  Many, many of them have affected south-east Queensland and NSW.

The worst natural disaster in recorded Australian history was in March 1899 when TC Mahina (the Bathurst Bay cyclone) killed 307 people.

Here are some other significant tropical cyclones recorded by the Bureau:

February 1893 a cyclone crossed near Yeppoon.  This led to the Brisbane River floods.

January 1918. The Mackay cyclone, which caused many deaths.  There was a large storm surge and a barometric pressure reading of 932.6 hPa in a private barometer, and less than 944.8 hPa at the Post Office as the flange on the instrument prevented the needle from going lower.  Inland rainfall caused the highest recorded flood in the Fitzroy River.

March 1918. The Innisfail cyclone.  The pressure dropped to 926 hPa at Mourilyan Sugar Mill.  There was a large storm surge.  Almost all buildings in the town were destroyed or badly damaged.

March 1949.  A cyclone struck Rockhampton and Gladstone.

1967 TC Dinah affected southern Queensland and NSW.  The pressure dropped to 944.8 hPa at Sandy Cape.

In Queensland, counting only those cyclones that have actually crossed the coast, not just approached, here is a list of tropical cyclones since 1970 (see Figure 6) that have struck south of the Tropic of Capricorn (Rockhampton or Yeppoon.)

February 1971 TC Dora

February 1972 TC Daisy

March 1972 TC Emily

January 1974 TC Wanda

March 1974 TC Zoe

February 1976 TC Beth

March 1976 TC Dawn

February 1981 TC Cliff

March 1992 TC Fran

TC Nancy (January 1990) came close but did not actually cross the coast.

TC Marcia in February 2015 crossed the coast near Shoalwater Bay before moving south over Rockhampton.

There is also an impressive list of cyclones which have caused deaths and wind, wave, and flooding damage in NSW.   These include cyclones from 1892.  Included are:

March 1939, TC crossed the coast at Cape Byron.

January 1950   The Sydney cyclone of 1950, when the pressure dropped to 988 hPa in Sydney.

February 1954, TC crossed the coast at Tweed Heads, where the pressure dropped to 973 hPa.

February 1957 TC crossed the coast south of Port Macquarie.

January 1967 TC Dinah caused a large storm surge in the Tweed River.

February 1967 TC Barbara crossed the coast near Lismore.

March 1974 TC Zoe crossed the coast just north of the border and travelled through northern NSW.

January 1990  TC Nancy did not cross the coast but passed about 50km east of Cape Byron.

The Reality

Contrary to Minister Crawford’s claim, and the media’s breathless and uncritical reporting, tropical cyclones in the past 48 years have decreased in number and intensity, and the proportion of severe tropical cyclones has also decreased.  Predictions of future trends are purely speculative.  The current 26 year lull in tropical cyclones hitting the south of Queensland and northern NSW is unusual.  In the past it was normal for cyclones to strike much further south than they do now.  We should not become complacent.

Drought and Climate Change Part 2: Rainfall deficiency

September 7, 2018

In my last post, I looked at long term rainfall trends across Southern, South Eastern, and South Western Australia, and found no cause for alarm at recent rainfall decline.  Droughts can occur at any time and cause much hardship across wide parts of the country.  Global Warming Enthusiasts are gnashing their teeth, believing man-made climate change is making droughts worse.  Greg Jericho in the Guardian wrote last Thursday 30th August, “If you are a prime minister going out to the rural areas and you’re not talking about climate change, and you’re not suggesting that droughts are more likely to occur and thus farmers need to take greater responsibility, then you are failing in your job.”

Are droughts really “more likely to occur” with climate change, and is there any evidence they are becoming more frequent, more intense, and more widespread with global warming?

The Bureau of Meteorology says:

Drought in general means acute water shortage.

The Bureau’s drought maps highlight areas considered to be suffering from a serious or severe rainfall deficiency…. for three months or more….

……

  • Serious rainfall deficiency: rainfall lies above the lowest five per cent of recorded rainfall but below the lowest ten per cent (decile range 1) for the period in question,
  • Severe rainfall deficiency: rainfall is among the lowest five per cent for the period in question.”

This map of meteorological drought (areas in the lowest ten and five percent of 12 months rainfall to 31 August) shows the extent across Australia:

Fig. 1:  Recent 12 month Rainfall Deficiency Australia

12m drought map

Parts of central and southern inland Queensland, parts of eastern South Australia, many parts of New South Wales, and small areas of Victoria are in drought.  Notice that the droughted areas are separated by areas that are not in drought.

But, but… all of NSW is in drought, isn’t it?

100% of NSW has been drought declared, and 54.7% of Queensland, and indeed some parts are in a very bad way.   But “drought declaration” is the term the media, politicians, and general public don’t understand.  They assume that because 100% of NSW is drought declared, this means all of NSW is in drought.  Not so.  Drought declaration is a political or at best administrative instrument for giving drought assistance to farmers and communities.  Some areas of Queensland that have not yet been drought declared really are in the grip of drought; some “drought declared” areas of NSW are not in drought, as this map of NSW (6 months March to August) shows:

Fig. 2: 6 month Rainfall deficiency NSW

NSW map 6m

Of course the blank areas have had below average rainfall, which may turn into full blown drought, so the NSW government is being proactive.  However, they are not at this time in meteorological drought with serious or severe rainfall deficiency.

Trends in Drought Incidence

In the bigger picture, how widespread, how intense, how long lasting, and how frequent are droughts becoming in Australia?  For this analysis I use monthly rainfall data from 1900 to July 2018 from the Bureau of Meteorology at their Climate Change page, and calculate the number of months where the rainfall total of the previous 12, 18, 24, or 36 months shows severe deficiency (in the lowest 5 percent of all months since 1900) or serious deficiency (in the lowest 10 percent).  (I am looking at droughts that last at least 12 months, not just short dry spells, and 12 months total rainfall includes rain in all seasons.)

I do this for various regions, as shown on the map below.

Fig. 3:  Australian Regions

Climate regions

I have plotted the number of consecutive months where the 12, 18, 24, and 36 month totals are in the lowest 5% and 10% of their respective values since 1900, and calculated the trend in months per century of increase or decrease. There are 96 plots, so I will only show a couple of examples, and summarise the results in Table 1 below.

Table 1:  Trends in Drought Incidence (Months per 100 Years) for various Australian Regions

Trend table

A negative trend indicates decreasing drought incidence, shaded green; a positive trend indicates increasing incidence, shaded pink.

Australia wide, and in the regions of Northern and Southern Australia and the Murray Darling Basin, and South Australia as a whole, since 1900 droughts of all lengths have become less frequent, and because these are broad regions, less widespread.  There is no evidence that climate change is making droughts more likely to occur, except for smaller areas (Victoria, Tasmania, and SW Australia) which have an increasing frequency of droughts of all lengths.

36 month dry periods are more frequent in SW Australia, SE Australia, Eastern Australia, Tasmania, Victoria, (and interestingly Queensland, but only for <10% deficiency).

Some examples will illustrate the complexity of the picture.

Fig. 4:  Number of consecutive months per calendar year of 12 months severe rain deficiency: Australia

12m 5% Aust

Fig. 5:  Periods of 36 months serious rain deficiency: Australia

36m 10% Aust

In the past droughts of all lengths and severity were more widespread across Australia.

Fig. 6:  Periods of 36 months severe rain deficiency: Southern Australia

36m 5% Sthn Aust

Similarly, multi-year periods of severe rain deficiency were much more frequent and widespread across Southern Australia before 1950.  In the last 50 years there has been only one month where the 36 month total was in the lowest 5th percentile.

Fig. 7:  Periods of 12 months severe rain deficiency: New South Wales

12m 5% NSW

Fig. 8:  Periods of 36 months severe rain deficiency: New South Wales

36m 5% NSW

Fig. 9:  Periods of 12 months serious rain deficiency: New South Wales

12m 10% MDB

Fig. 10:  Periods of 36 months serious rain deficiency: New South Wales

36m 10% NSW

Across NSW, 4 months of 2018 had 12 month totals in the serious deficiency range, but none in the severe range.  Droughts of all severity and duration have become less frequent and widespread.  The Millennium Drought lasted longer but was less severe than the Federation Drought.

The Murray-Darling Basin lies across four states including most of NSW, and is Australia’s premier food and fibre producing region.  The current drought is affecting many areas in this region.

Fig. 10:  Periods of 12 months severe rain deficiency: Murray-Darling Basin

12m 5% MDB

Fig. 11:  Periods of 12 months serious rain deficiency: Murray-Darling Basin

12m 10% MDB

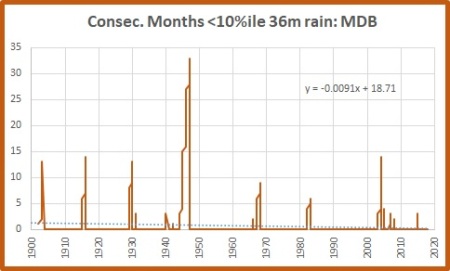
Fig. 12:  Periods of 36 months serious rain deficiency: Murray-Darling Basin

36m 10% MDB

We can conclude from these plots of the Murray-Darling Basin that this drought is patchy, and while nasty, is not the most intense or long lasting even in living memory, let alone on record, and that droughts are becoming less frequent and less widespread.

Fig. 13:  Periods of 36 months severe rain deficiency: Queensland

36m 5% Qld

Fig. 14:  Periods of 36 months serious rain deficiency: Queensland

36m 10% Qld

Queensland has little trend in frequency of drought with severe deficiency over three years but less severe droughts have been more frequent- due to the droughts of the 1990s and the Millennium drought.

Fig. 15:  Periods of 36 months serious rain deficiency: Victoria

36m 10% Vic

The Millennium Drought stands out as the longest period of widespread serious rain deficiency.

Fig. 16:  Periods of 36 months serious rain deficiency: South-West Australia

36m 10% SW Oz

Here we see that all but one month of all the 36 month periods of serious rain deficiency have occurred since 1970, reflecting the marked drying trend.  This really is an example of climate changing.

Winter rainfall

Fig. 17:  Winter Rainfall Deciles across Australia, 2018

winter rain 2018

According to the Climate Council, “Climate change has contributed to a southward shift in weather systems that typically bring cool season rainfall to southern Australia.”  However the usual areas affected by this southwards shift, Tasmania, south-west Victoria, southern South Australia, and most of the south-west of Western Australia, have had an average to above average winter.  Droughted areas are to the north.   The southwards shift of weather systems caused by Climate Change cannot be claimed to have any part in this drought.

Drought is a dreadful calamity wherever and whenever it occurs.  And on top of other difficulties in Queensland is the bureaucratic approval process under Vegetation Management regulations before graziers can push mulga to feed starving stock.

This drought may get worse if a full El Nino develops.  It is unlikely to break before six months or even 18 months.  By then it will be much more severe and widespread.  However, climate change has not caused this drought.  While there is evidence for increasing drought frequency and thus likelihood of more drought in the future in Tasmania, southern Victoria, southern South Australia, and the south-west of Western Australia, across the rest of Australia there is strong evidence that droughts have become less frequent, less severe, less widespread, and shorter.  If climate change is claimed as the cause of increasing droughts in the far southern regions, then climate change must also be causing less frequent droughts across the vast bulk of Australia, where droughts are always “likely to occur”, but not “more likely”.

Drought and Climate Change Part 1: Long Term Rainfall

September 1, 2018

The current drought conditions in New South Wales and large parts of Queensland are getting a lot of media attention, and of course the usual suspects are linking it to climate change and our apparently “unambitious” emissions targets in the NEG.  But are droughts really becoming “the new normal”, and are they becoming more frequent, more intense, and more widespread with global warming?

There are two aspects to consider: long term rainfall trends in various regions, and periods of rainfall deficiency.  In this post I will look at long term rainfall, and Part 2 will look at rainfall deficiency i.e. drought incidence.

Long term rainfall trends

Everyone “knows” southern Australia is getting drier.  Paul West in Feeding Australia Pt 2 on the ABC says there has been a 28% decrease in rainfall over the past 30 years.  The Climate Council says “Over the past 30 years, there has been a discernible decrease in rainfall across southern Australia.” That’s their headline; in the details the Climate Council’s June 2018 Fact Sheet says:

“Climate change has contributed to a southward shift in weather systems that typically bring cool season rainfall to southern Australia. Since the 1970s late autumn and early winter rainfall has decreased by 15 percent in southeast Australia, and Western Australia’s southwest region has experienced a 15 percent decline in cool season rainfall.”

Both are true, but both are only half true, and in fact the ABC and the Climate Council as usual lie by omission.

The whole story is more complex but shows a completely different, and much less dramatic picture.  Using data for cool season (April- September) rainfall from the Bureau of Meteorology we can check on different time periods.

Fig. 1:  Cool season rainfall, Southern Australia, 1988-2017

Cool rain Sth Oz 19882017

Yes, if this is what Paul West based his statement on, 2017 had about 28% less rain than in 1988.  I hope he didn’t- comparing single years would be pretty bad science.  However there has been a marked decrease in cool season rainfall over this period, so the Climate Council is quite correct.

However, Figure 2 shows the big picture- since 1900.

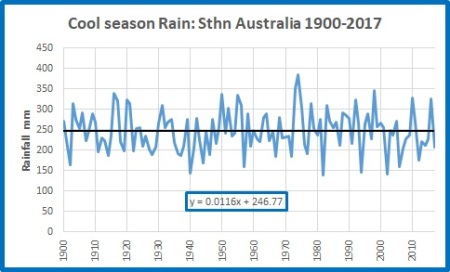
Fig. 2: Cool season rainfall, Southern Australia, 1900-2017

Cool rain Sth Oz 19002017

Oops! Rainfall has in fact increased over southern Australia.

The reason for the current gnashing of teeth is that “living memory” only goes back about 70 years, and we are comparing current conditions with those of a few decades ago.  Figure 3 shows the average rainfall for the 10 year periods up to 2017.

Fig. 3: 10 year average Cool season rainfall, Southern Australia, 1900-2017

Cool rain Sth Oz 19002017 10yrs

As you can see, the average rainfall of the 10 years 2008 to 2017 was about 7% less than in the 1950s, 1970s, 1980s, and 1990s, but more than the 1920s and 1930s, and nearly 10% more than the 10 years to 1947.  Of the 10 decades before this one, five had less rain and five had more.  Southern Australian cool season rainfall is not “the new normal”, it is in fact “the old normal”.

Let’s now look at South-East Australia, below 33 degrees South and east of 135 degrees East.

Fig. 4: Cool season rainfall, South-Eastern Australia, 1988-2017

Cool rain SE Oz 19882017

Again there is an obvious decrease in rain over the last 30 years.

Fig. 5: Cool season rainfall, South-Eastern Australia, 1900-2017

Cool rain SE Oz 19002017

There has been a small decrease in cool season rainfall over the whole 118 years.  Again there was a marked step up in rainfall from the mid-1940s.  The plot of 10 year averages shows this more clearly:

Fig. 6: 10 year average cool season rainfall, South-Eastern Australia, 1900-2017

Cool rain SE Oz 19002017 10yrs

There was a decreasing trend up to the 1940s, and a decreasing trend from the 1950s to now.  The current 30 to 40 year decrease is nothing new.

However, rainfall records for individual sites go back much longer.  What do these show?  Here is a plot of monthly rainfall for all months at Penola, in South Australia, starting in 1863:

Fig. 7: Monthly rainfall (all months January 1863 – December 2017) at Penola, S.A.

Penola rain monthly

A very long term decreasing trend.  Running 12 month totals show wetter and drier periods:

Fig. 8: 12 month running total rainfall (all months January 1863 – December 2017) at Penola, S.A.

Penola rain 12m

There were very severe droughts around World War 1 and the late 1960s, but a big step up in the 1950s.  This is more obvious in a plot of 10 year totals:

Fig. 8: 120 month running total rainfall (all months January 1863 – December 2017) at Penola, S.A.

Penola rain 120m

This site shows a very long term rainfall decrease, complicated by droughts and strings of wetter years, and a huge step up in the middle of last century.  This site is one of many of varying lengths in the High Quality Rainfall dataset.  Nearly all show the mid-century step up, some show a small long term increase, some show a small long term decrease.

I amalgamated all 84 stations, and here are the plots for all months. Firstly, the number of stations reporting:

Fig. 9: Count of all stations in S.E. Australia reporting, all months

All SE sites Count

There are a number of long term sites.  There were 50 sites in 1898, as in 2017 (several had not yet reported January 2018).

Note: the following plots are of naïve means: there is no area averaging.

Fig. 10: S.E. Australia monthly rainfall (all months)

SE Oz all months

Note a small increase.  Now 12 month running totals of these means:

Fig. 11:  S.E. Australia 12 month rainfall (all months)

SE Oz 12 months

Now the 10 year running total of monthly means, but since 1898 when the number of stations was the same as now:

Fig. 12:  S.E. Australia 120 month rainfall (all months)

SE Oz 120 months 1898

The mid-century step up is obvious, with a decline since then.  The 10 year rainfall to December 2017 is about what it was a century ago.

I now turn to South West Australia.

Fig. 13: Cool season rainfall, South-Western Australia, 1988-2017

Cool rain SW Oz 19882017

A very serious decline since 1988.

Fig. 14: Cool season rainfall, South-Western Australia, 1900-2017

Cool rain Sw Oz 19002017

As you can see, the decline has been around since 1900, but with a marked step down starting in 1968, with a steep but uneven decline since then.  10 year averages show this clearly.

Fig. 14: 10 year average cool season rainfall, South-Western Australia, 1900-2017

Cool rain SW Oz 19002017 10yrs

Conclusion:

The long term data show a complex picture of long term cool season rainfall decline in south-west and some parts of south-east Australia, while southern Australia as a whole shows a very small increase.  It is true that rainfall has declined, as the Climate Council and ABC claim, over the past 30 and 40 years in many parts, but that is only half the story.  The whole story is much less dramatic.  Rainfall has been declining for a long time in WA, and in south-east Australia has been declining in two stages, separated by a large step up in rainfall in the middle of last century.

The current low rainfall is not “the new normal” but entirely consistent with “the old normal” and should be seen as just plain “normal”.  This is Australia.  Get used to it.